House Oversight Flight Search
No complete routes with both start and end airports were found in this result set yet.
HOUSE_OVERSIGHT_016478.jpg
ID: 9456
Description:
Pages: 1
OCR done: 1
Downloaded: 1
OCR updated: 2026-04-09 10:25:14
Source status:
Local path: /HOUSE_OVERSIGHT_FILES/HOUSE_OVERSIGHT_016478.jpg

HOUSE_OVERSIGHT_016477.jpg
ID: 9455
Description:
Pages: 1
OCR done: 1
Downloaded: 1
OCR updated: 2026-04-09 10:25:12
Source status: needs_review
Local path: /HOUSE_OVERSIGHT_FILES/HOUSE_OVERSIGHT_016477.jpg
People JSON:
- Karen Friedman Agnifilo
SUPREME COURT OF THE STATE OF NEW YORK
APPELLATE DIVISION: FIRST DEPARTMENT
THE PEOPLE OF THE STATE OF NEW YORK,
Respondent,
AFFIRMATION IN RESPONSE TO NON-PARTY MOTION
N.Y. County Ind. No. 30129/10
Cal. Date: December 31, 2018
CYRUS R. VANCE, JR.
District Attomey
New York County
One Hogan Place
New York, New York 10013
(212) 335-9000
Karen Friedman Agnifilo
Assistant District Attomey
Of Counsel
HOUSE_OVERSIGHT_016477
HOUSE_OVERSIGHT_014489.jpg
ID: 9454
Description:
Pages: 1
OCR done: 1
Downloaded: 1
OCR updated: 2026-04-09 10:25:11
Source status: needs_review
Local path: /HOUSE_OVERSIGHT_FILES/HOUSE_OVERSIGHT_014489.jpg
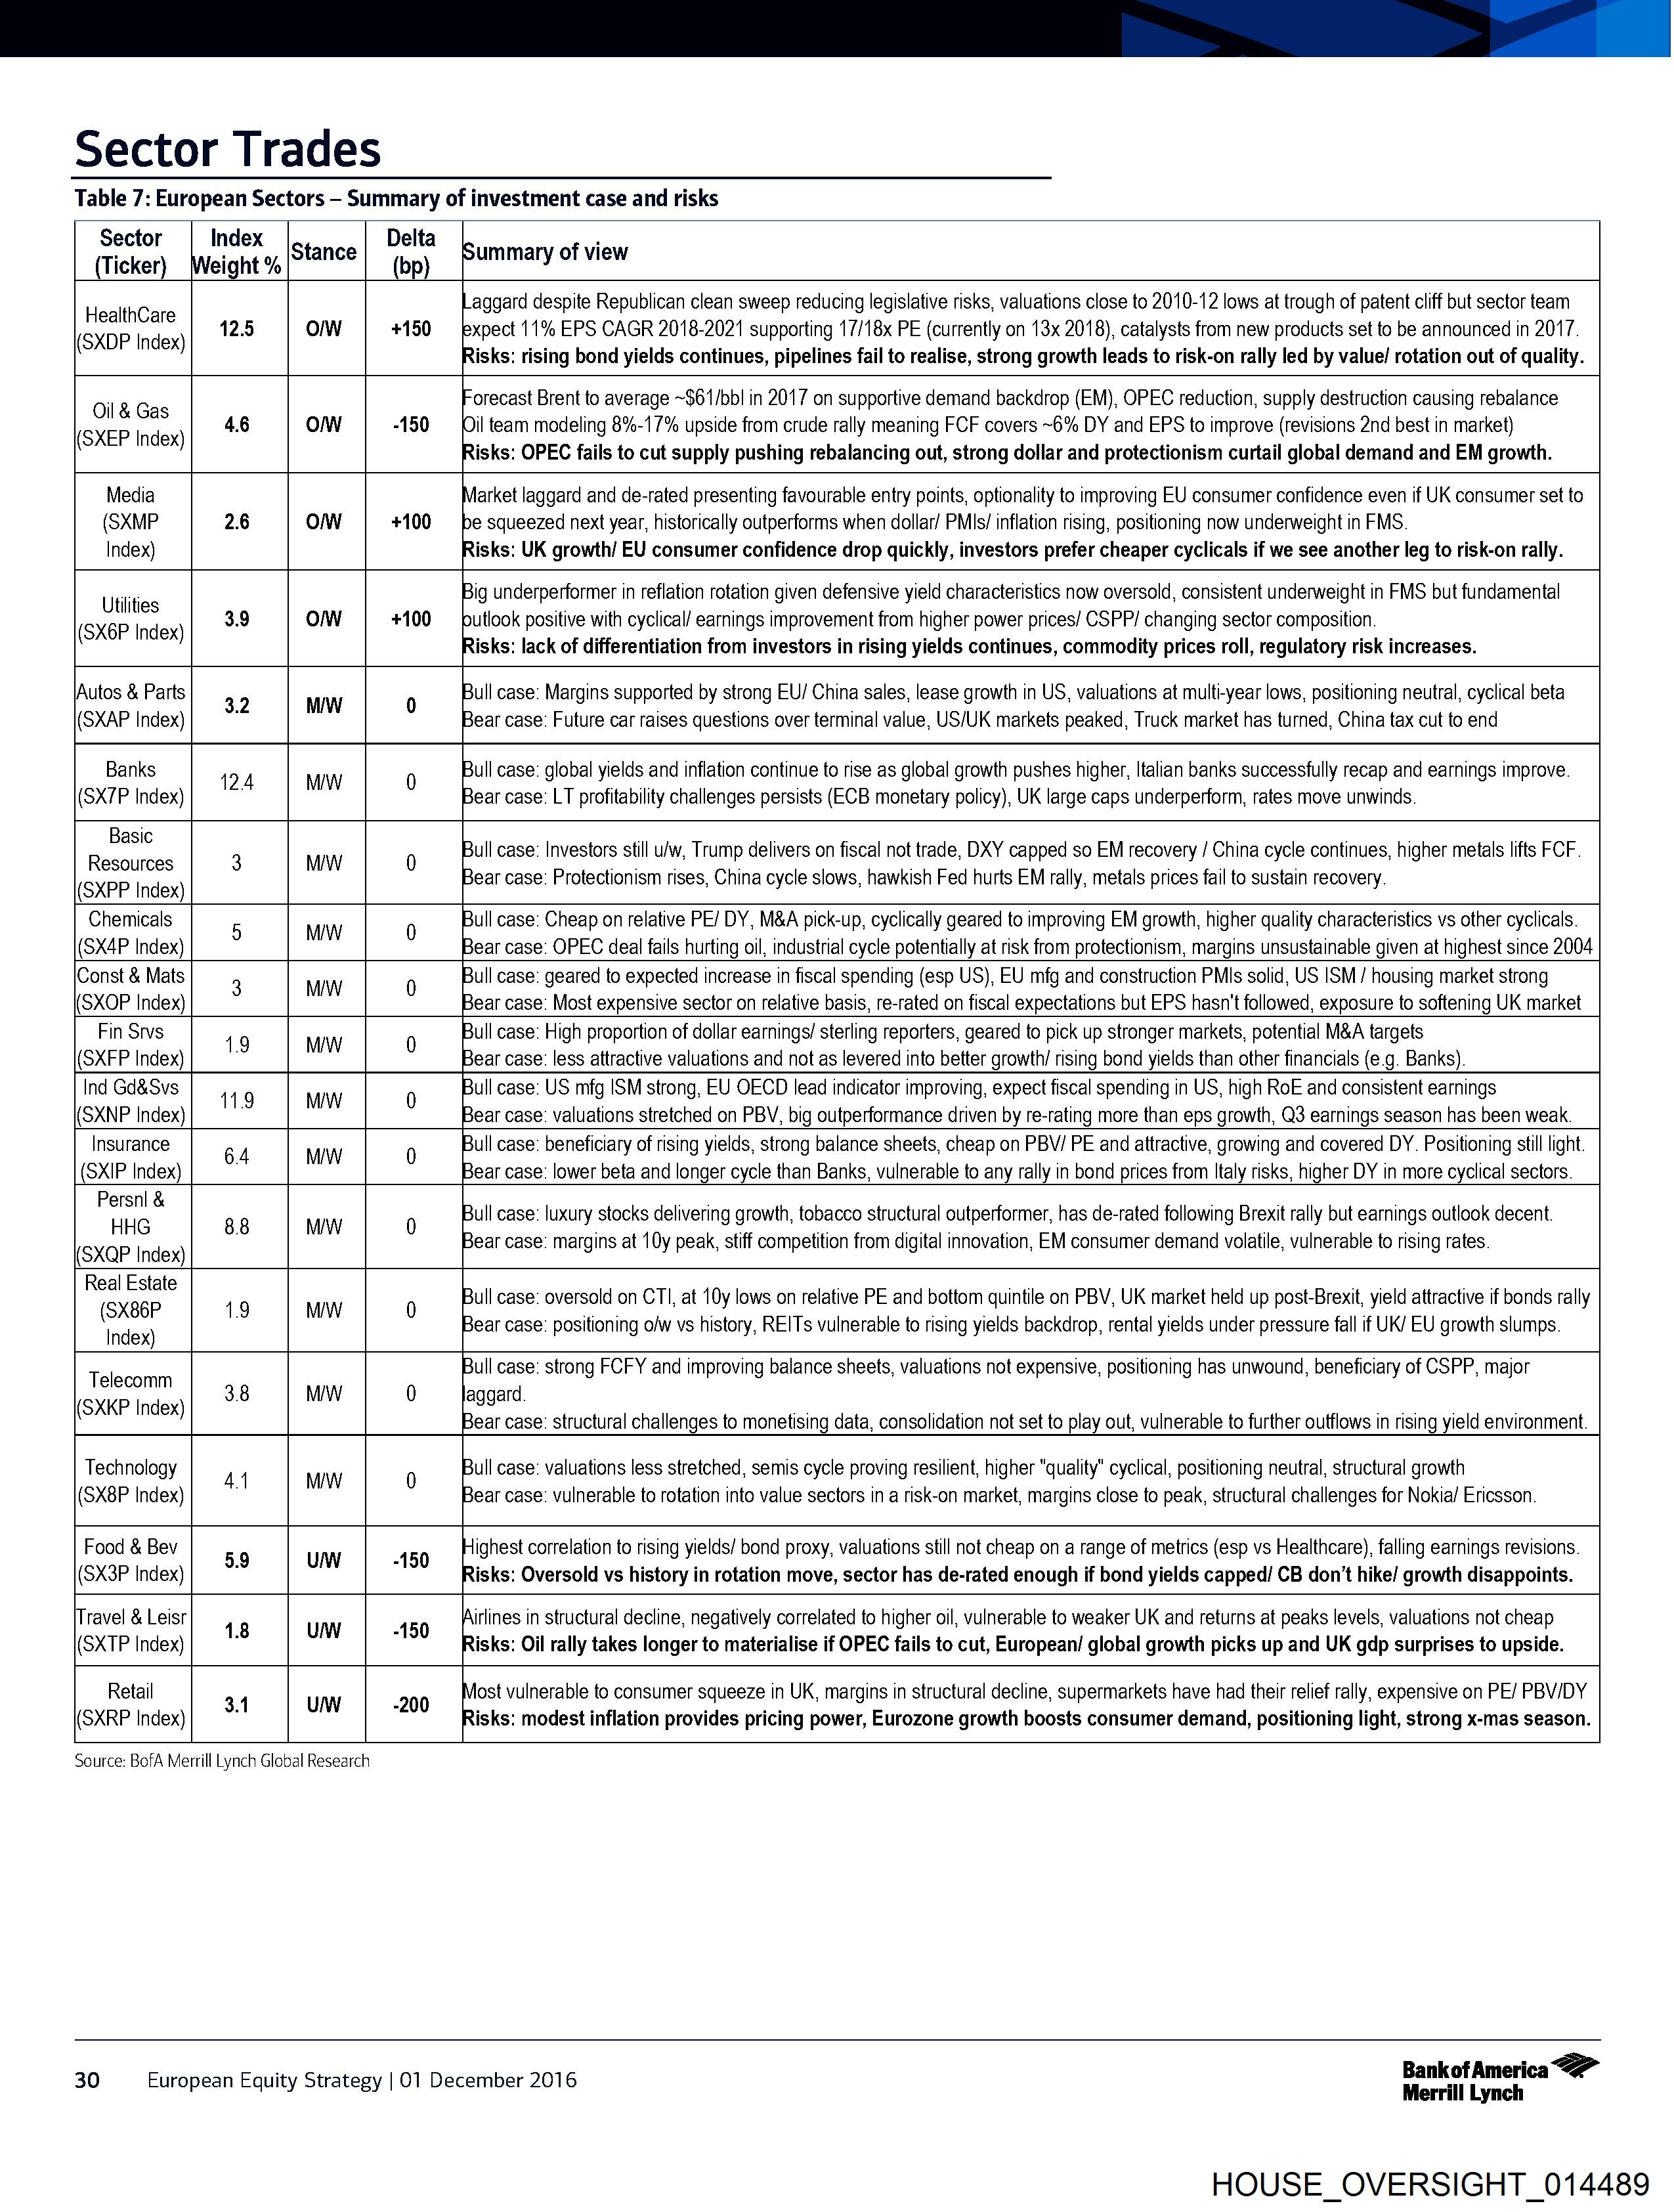
Sector Trades
Table 7: European Sectors — Summary of investment case and risks
Sector | Index |ctance| Pelt? boummary of view
(Ticker) Weight % (bp) i
HealthCare aggard despite Republican clean sweep reducing legislative risks, valuations close to 2010-12 lows at trough of patent cliff but sector team
(SXDP Index) O/W +150 bxpect 11% EPS CAGR 2018-2021 supporting 1//18x PE (currently on 13x 2018), catalysts from new products set to be announced in 2017.
isks: rising bond yields continues, pipelines fail to realise, strong growth leads to risk-on rally led by value/ rotation out of quality.
orecast Brent to average ~$61/bbl in 2017 on supportive demand backdrop (EM), OPEC reduction, supply destruction causing rebalance
OW Oil team modeling 8%-1/% upside from crude rally meaning FCF covers ~6% DY and EPS to improve (revisions 2nd best in market)
isks: OPEC fails to cut supply pushing rebalancing out, strong dollar and protectionism curtail global demand and EM growth.
Oil & Gas
(SXEP Index)
arket laggard and de-rated presenting favourable entry points, optionality to improving EU consumer confidence even if UK consumer set to
OW +100 be squeezed next year, historically outperforms when dollar/ PMIs/ inflation rising, positioning now underweight in FMS.
isks: UK growth/ EU consumer confidence drop quickly, investors prefer cheaper cyclicals if we see another leg to risk-on rally.
ig underperformer in reflation rotation given defensive yield characteristics now oversold, c
HOUSE_OVERSIGHT_014488.jpg
ID: 9453
Description:
Pages: 1
OCR done: 1
Downloaded: 1
OCR updated: 2026-04-09 10:25:06
Source status: needs_review
Local path: /HOUSE_OVERSIGHT_FILES/HOUSE_OVERSIGHT_014488.jpg
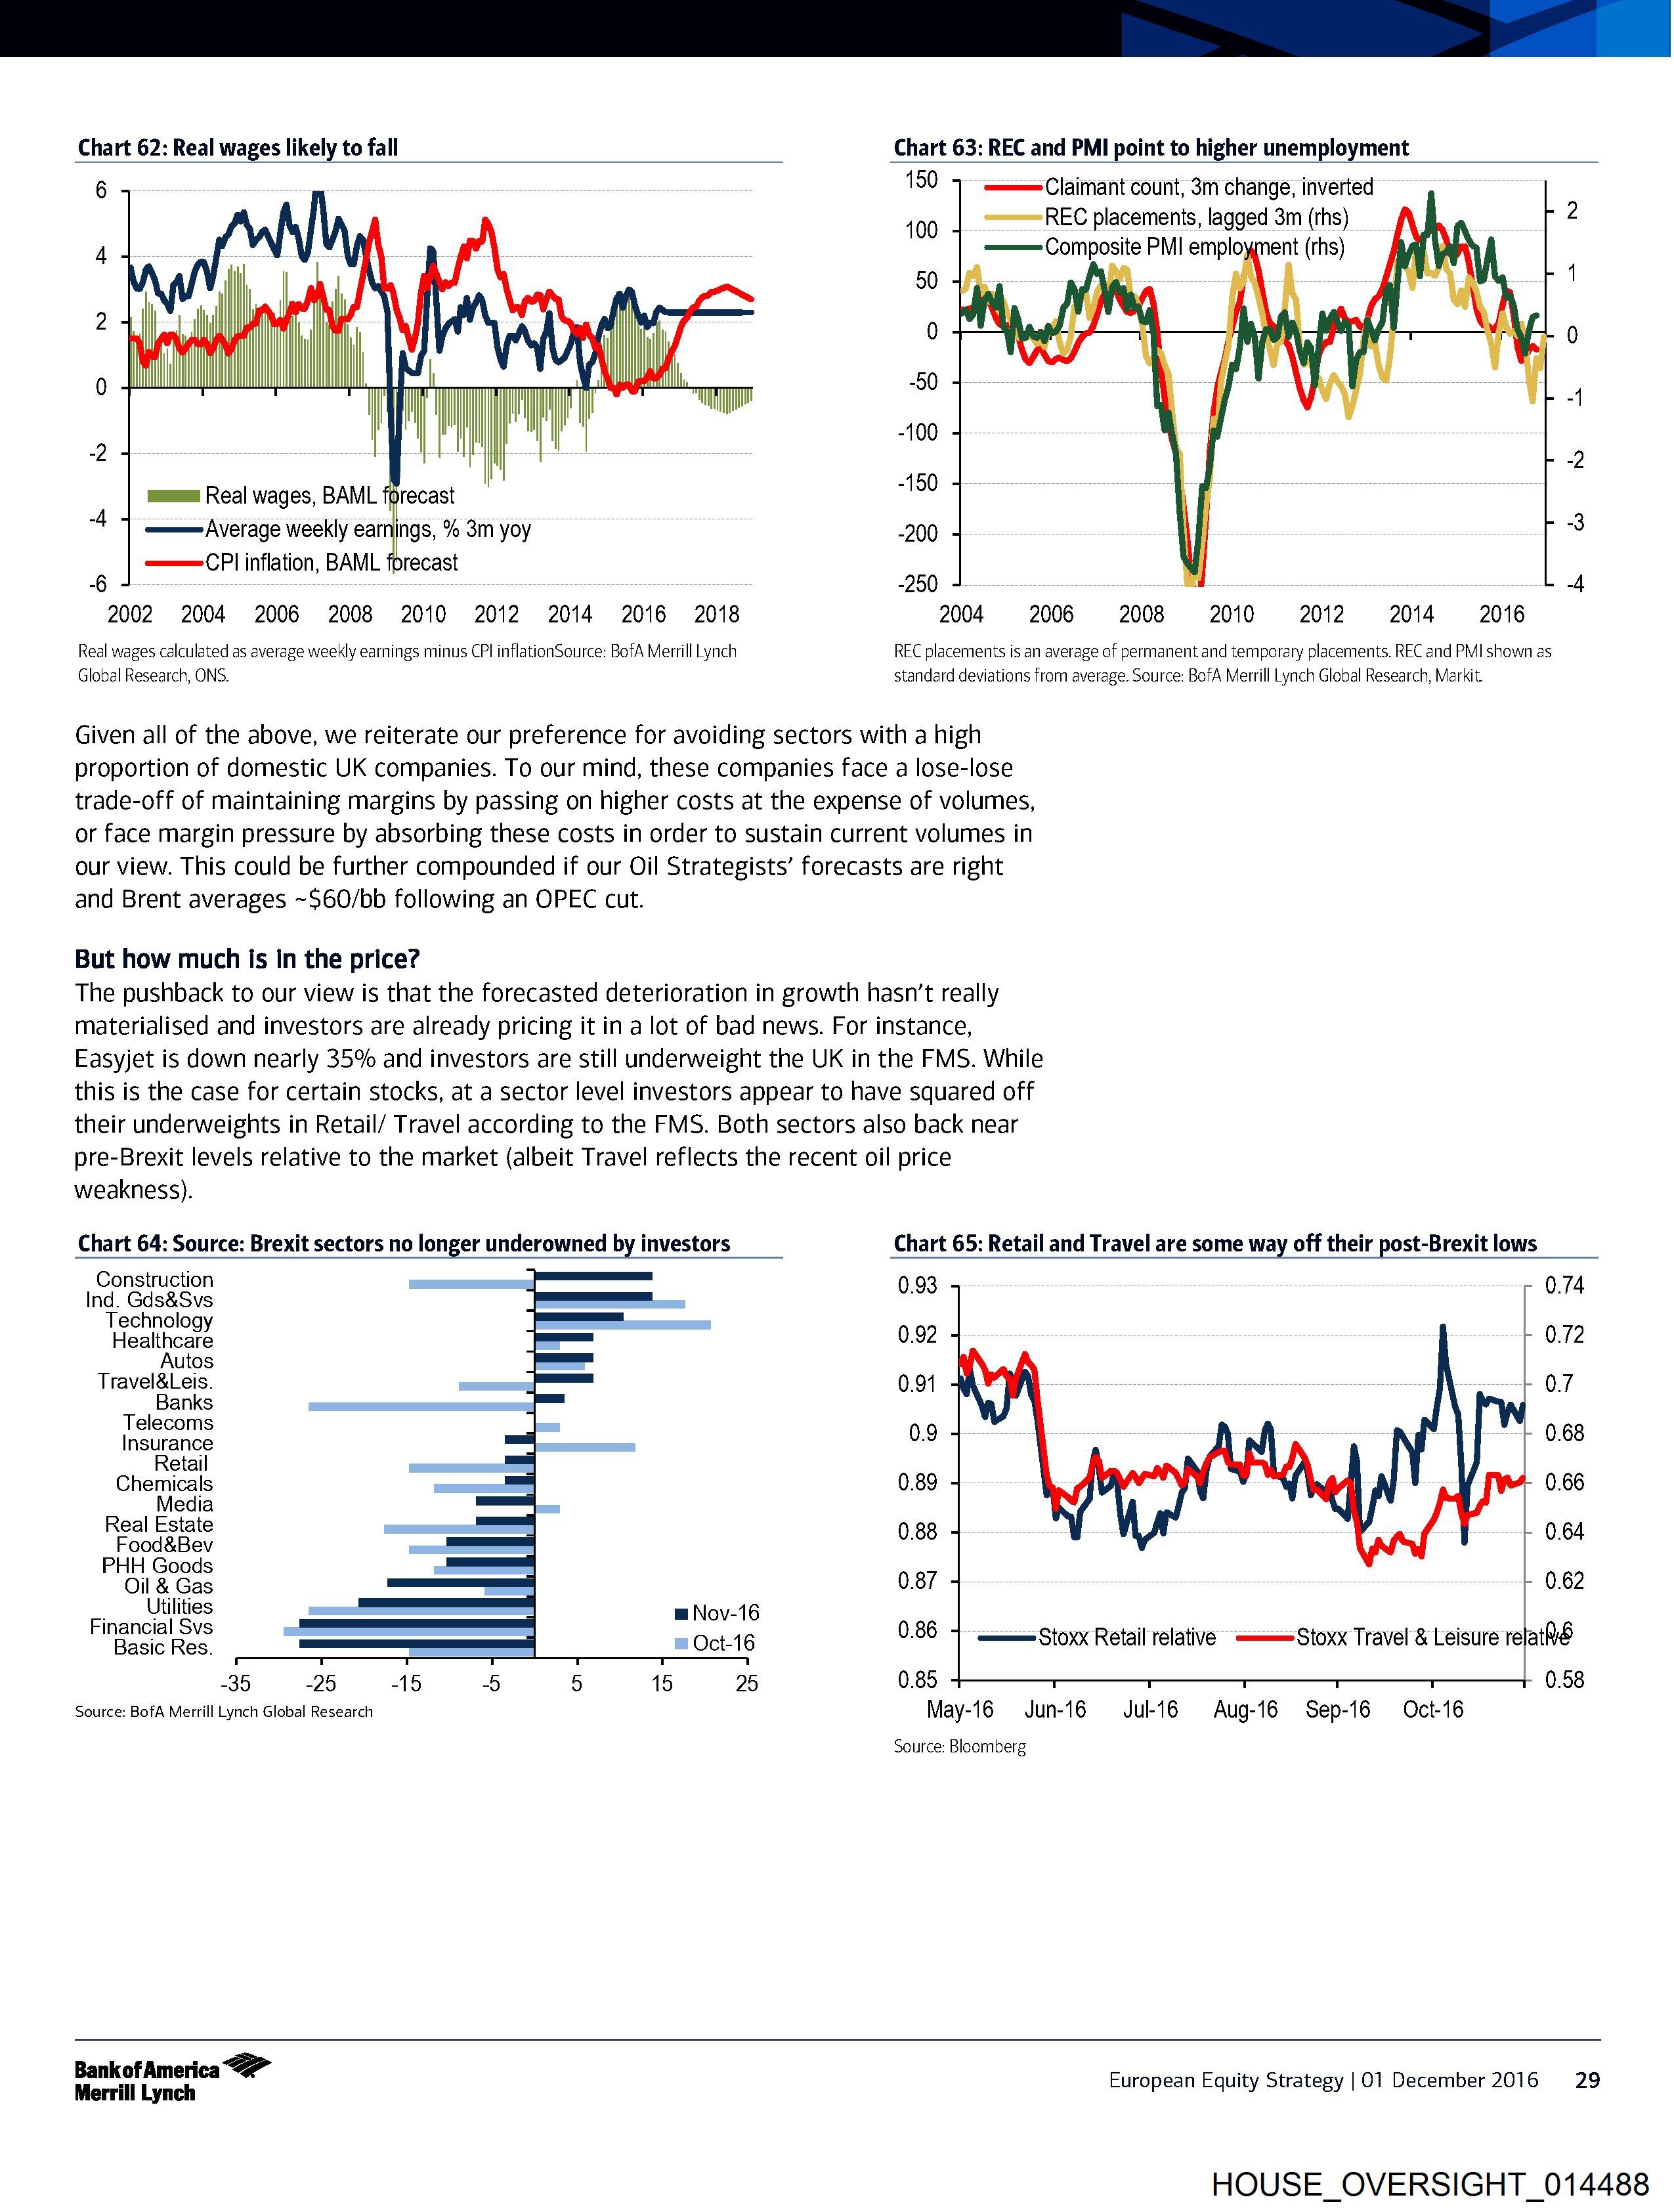
Chart 62: Real wages likely to fall Chart 63: REC and PMI point to higher unemployment
6 190 Claimant count, 3m change, inverted
100 REC placements, lagged 3m (rhs) N\ 2
44. \ — Composite PMI employment (rhs) bal an
, | 50 | | | |
ee ‘i
| a ‘ |
| -100
5 -2
mum Real wages, BAML forecast “190 |
a eeemAverage weekly earnings, % 3m yoy = -200 -3
ea (CPI inflation, BAML forecast
- -250 -4
2002 2004 2006 2008 2010 2012 2014 2016 2018 2004 =62006)=— 2008 )3=—— 2010) 3S 2012 2014 = 2016
Real wages calculated as average weekly earnings minus CPI inflationSource: BofA Merrill Lynch REC placements is an average of permanent and temporary placements. REC and PMI shown as
Global Research, ONS. standard deviations from average. Source: BofA Merrill Lynch Global Research, Markit
Given all of the above, we reiterate our preference for avoiding sectors with a high
proportion of domestic UK companies. To our mind, these companies face a lose-lose
trade-off of maintaining margins by passing on higher costs at the expense of volumes,
or face margin pressure by absorbing these costs in order to sustain current volumes in
our view. This could be further compounded if our Oil Strategists’ forecasts are right
and Brent averages ~$60/bb following an OPEC cut.
But how much is in the price?
The pushback to our view is that the forecasted deterioration in growth hasn't really
materialised and investors are already pricing it in a lot of bad news. For instance,
Easyjet is down nearly 35% and investors ar
HOUSE_OVERSIGHT_014487.jpg
ID: 9452
Description:
Pages: 1
OCR done: 1
Downloaded: 1
OCR updated: 2026-04-09 10:25:04
Source status: needs_review
Local path: /HOUSE_OVERSIGHT_FILES/HOUSE_OVERSIGHT_014487.jpg
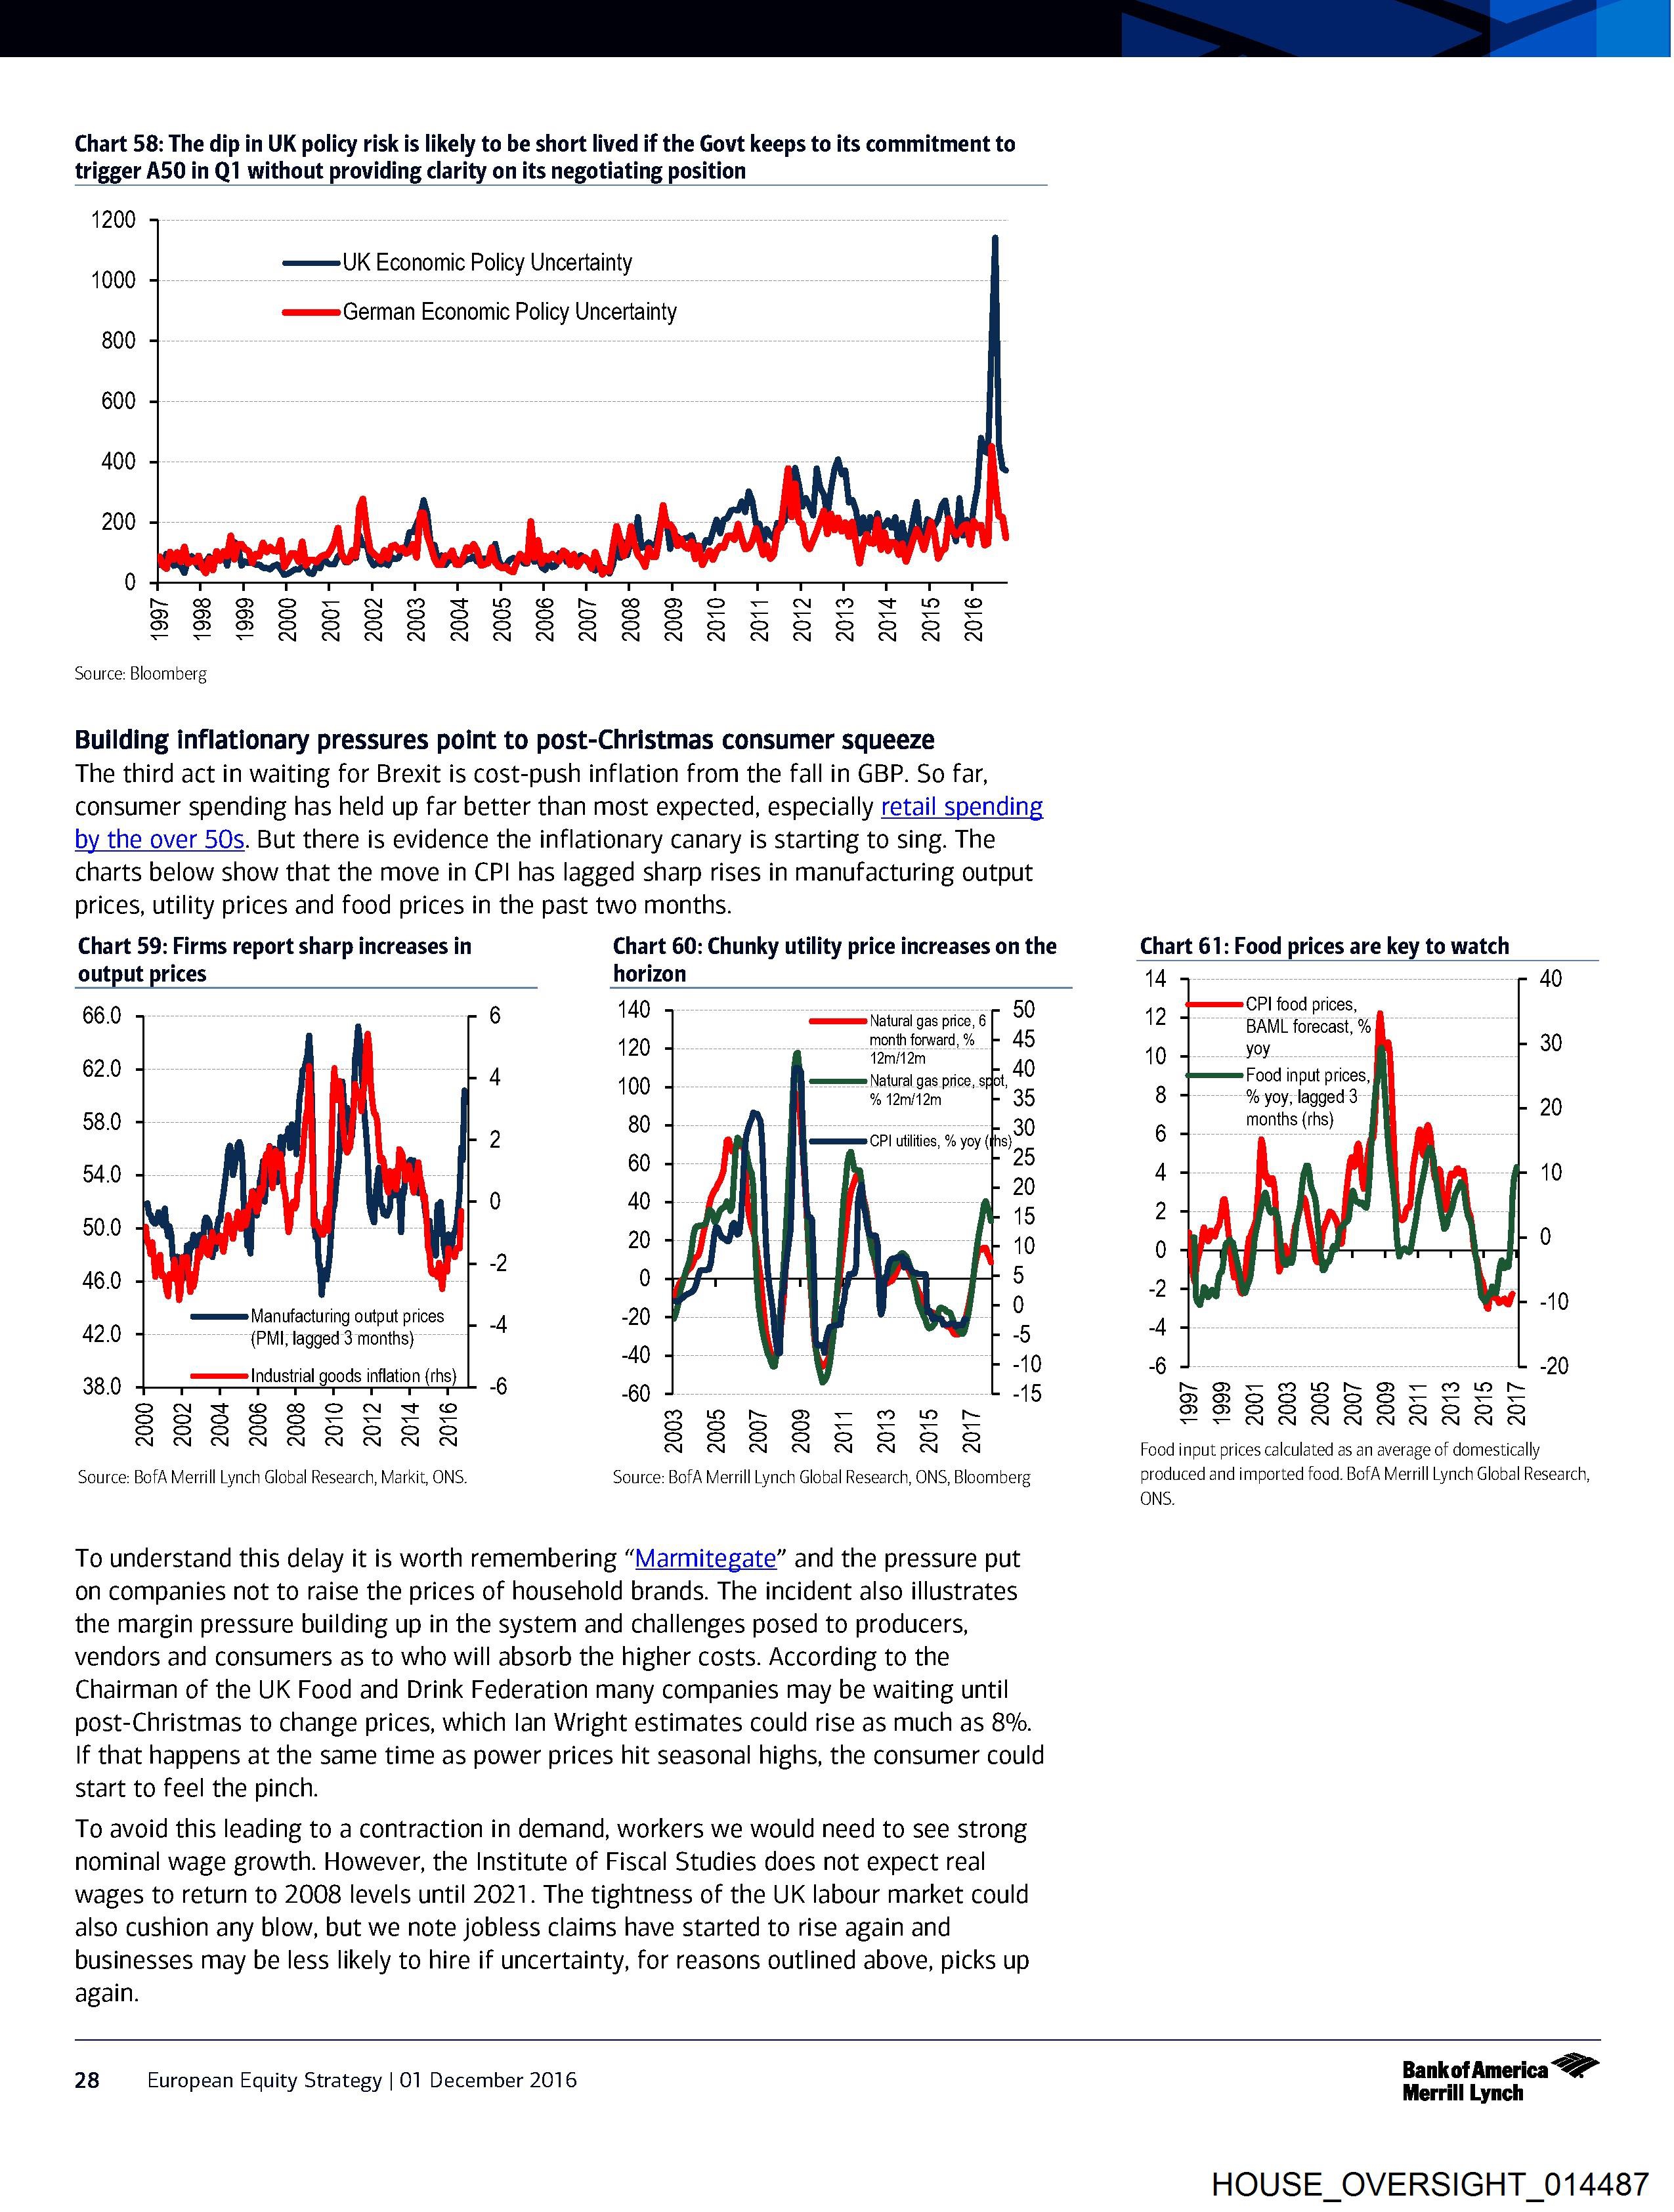
Chart 58: The dip in UK policy risk is likely to be short lived if the Govt keeps to its commitment to
trigger A50 in Q1 without providing clarity on its negotiating position
1200
1000 == UK Economic Policy Uncertainty
es (German Economic Policy Uncertainty
800
600
400
200
0
1997
1998
1999
2000
2003
2004
2005
2006
2007
2008
2009
2001
2002
2010
2011
2012
2013
2014
2015
2016
Source: Bloomberg
Building inflationary pressures point to post-Christmas consumer squeeze
The third act in waiting for Brexit is cost-push inflation from the fall in GBP. So far,
consumer spending has held up far better than most expected, especially retail spending
by the over 50s. But there is evidence the inflationary canary is starting to sing. The
charts below show that the move in CPI has lagged sharp rises in manufacturing output
prices, utility prices and food prices in the past two months.
Chart 59: Firms report sharp increases in Chart 60: Chunky utility price increases on the
output prices horizon
66.0 140 qummmmms Natural gas price, 6 90
420 month forward, % A5
62.0 Nati ae pee. eet 40
100 gas price, 35
08.0 80 5-530
54.0 7 .
40 15
50.0 50 0
46.0 0 S)
ques [\lanufacturing output prices -20 0
42.0 (PMI; lagged 3 months) 40 -5
33.0 esses [dustrial goods inflation {rhs} 60 ; :
See se seezaeaeé Om Wo Be @wronyo we
SSSsesgRRR Sssssseges
=
—
Q
Source: BofA Merrill Lynch Global Research, Markit, ONS. Source: BofA Merrill Lynch Global Research, ONS, Bloomberg
To understand this delay it i
HOUSE_OVERSIGHT_014486.jpg
ID: 9451
Description:
Pages: 1
OCR done: 1
Downloaded: 1
OCR updated: 2026-04-09 10:25:00
Source status: needs_review
Local path: /HOUSE_OVERSIGHT_FILES/HOUSE_OVERSIGHT_014486.jpg
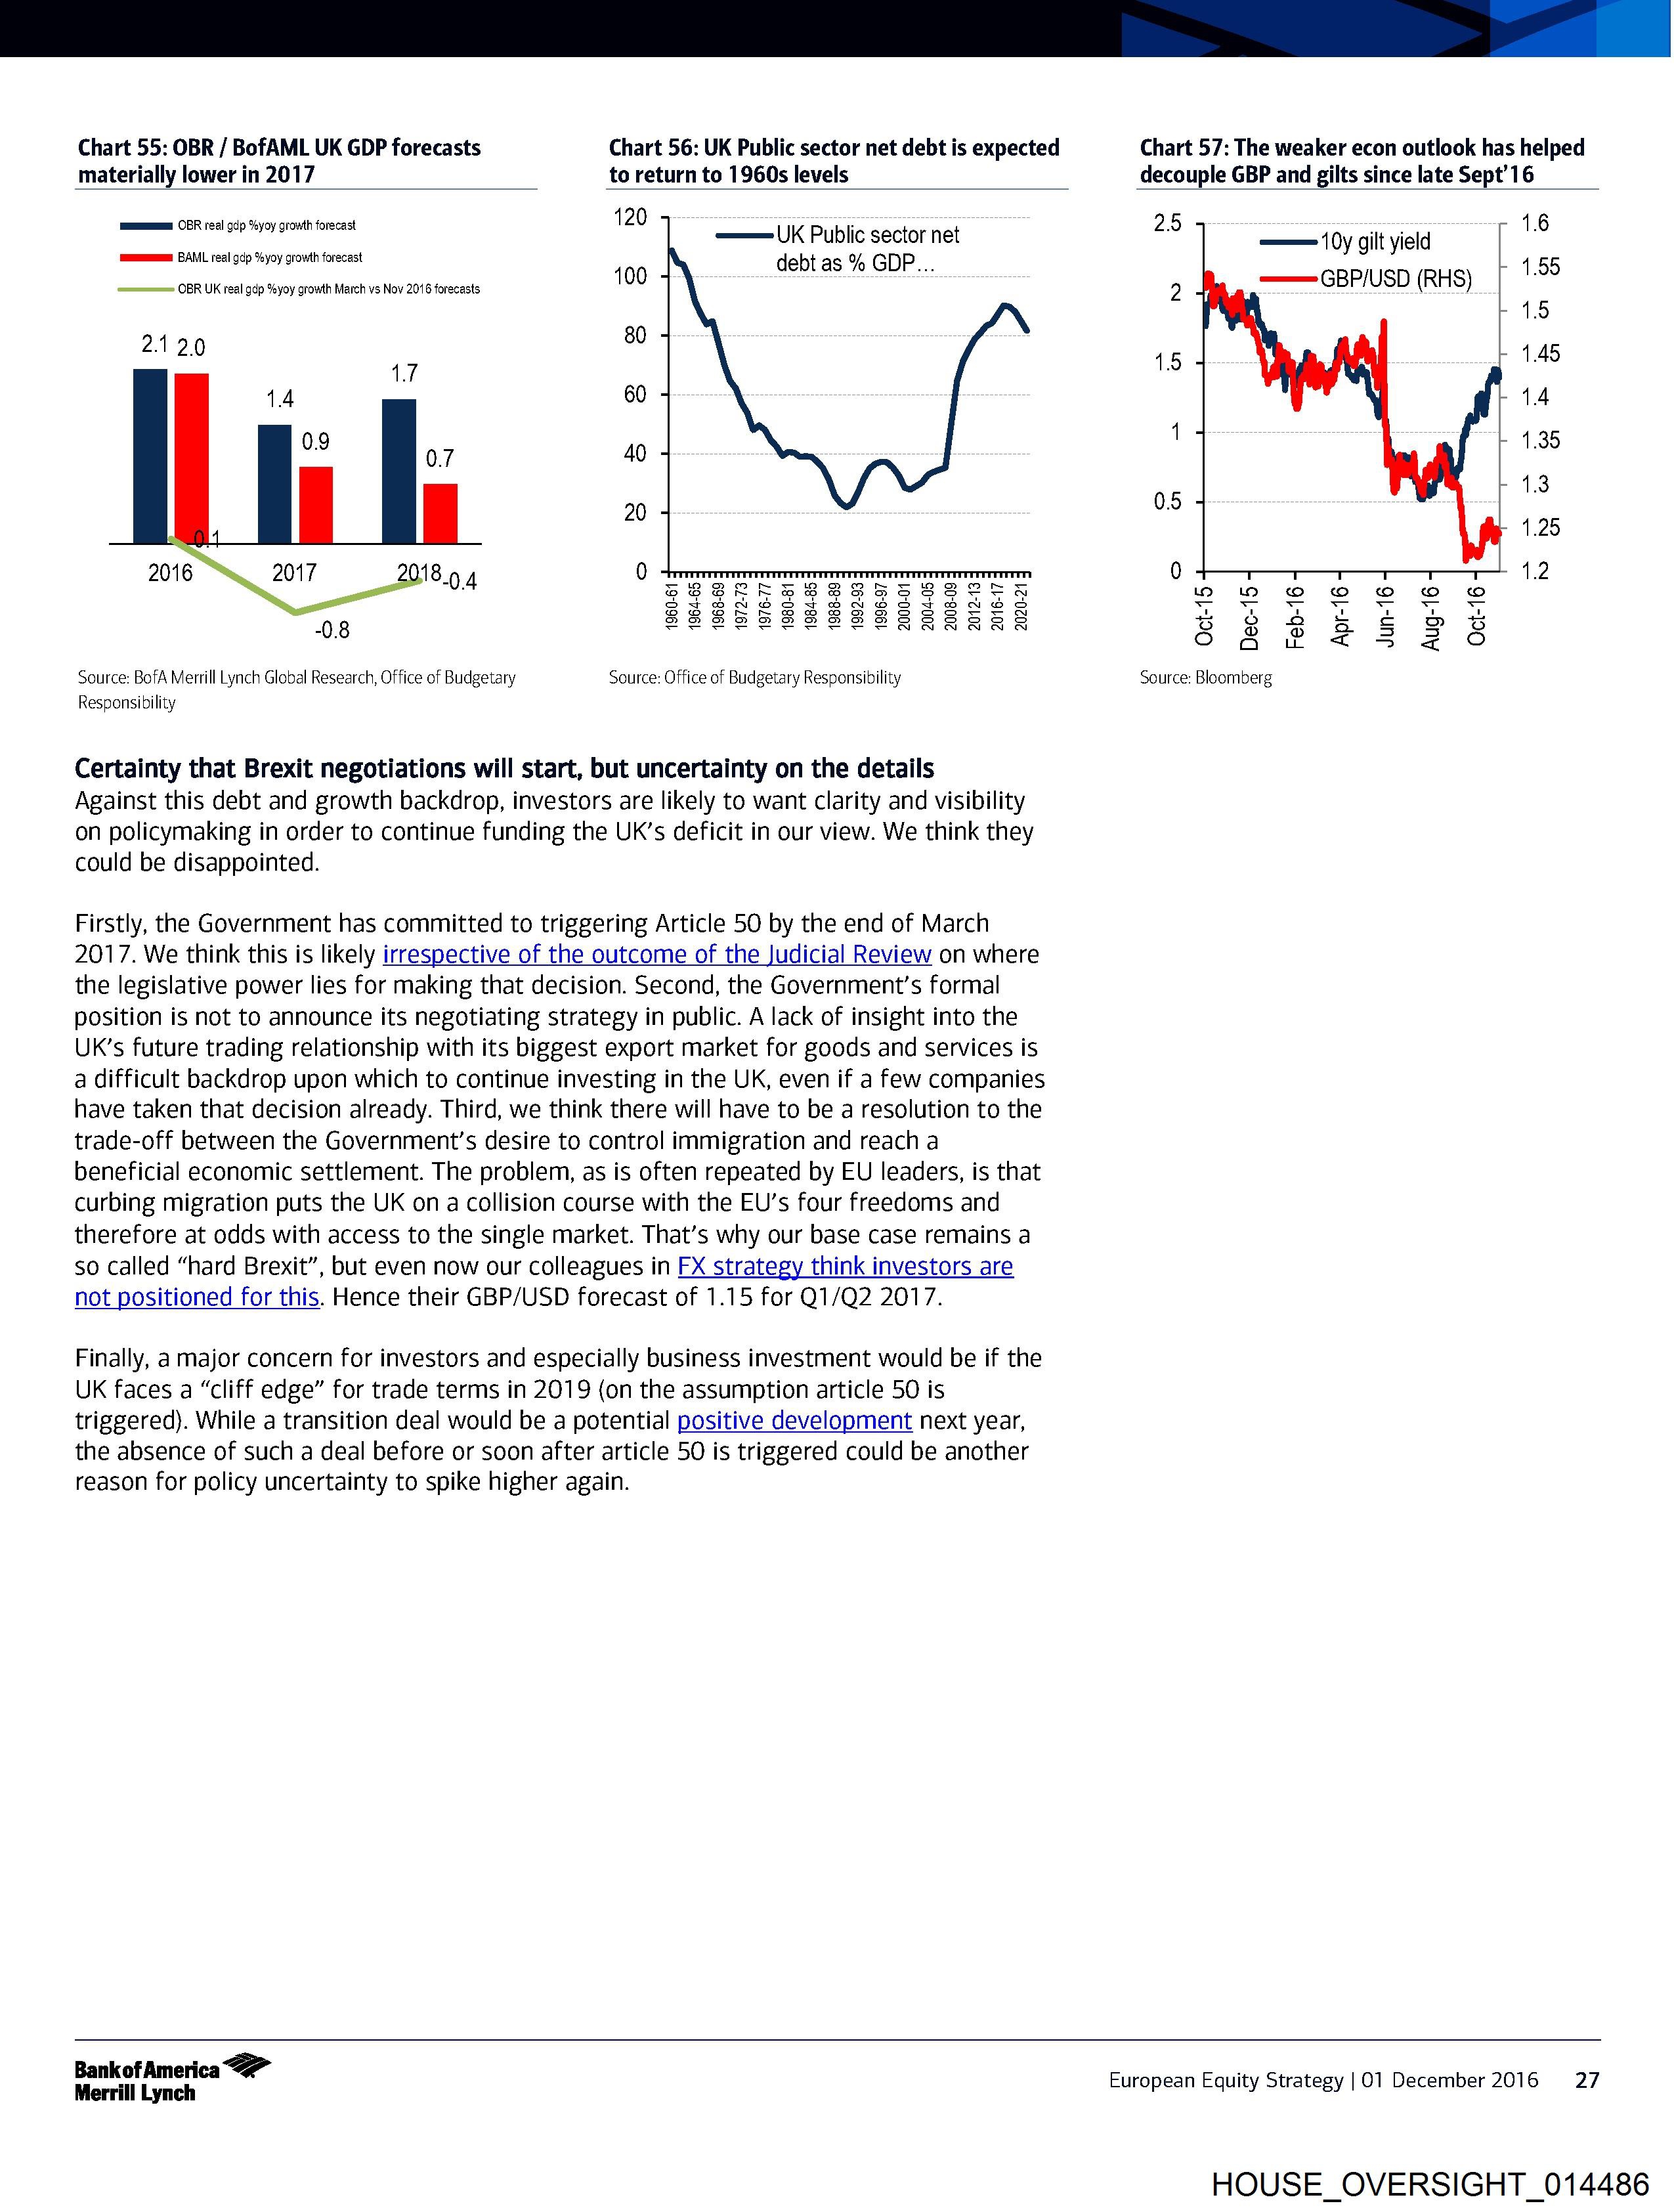
Chart 55: OBR / BofAML UK GDP forecasts Chart 56: UK Public sector net debt is expected Chart 57: The weaker econ outlook has helped
materially lower in 2017 to return to 1960s levels decouple GBP and gilts since late Sept’ 16
120
mus OBR real gdp %yoy growth forecast UK Public sector net 25 10y gilt yield | 6
mums BAML real gdp %yoy growth forecast )
gap "yoy g 100 debt as % GDP... 1.55
_——=GBP/USD (RHS)
OBR UK real gdp %yoy growth March vs Nov 2016 forecasts 2
1.5
80
212.0 7 15 1.45
60 1.4
1.35
40
1.3
20 0.5
1.25
2016 2017 2018.9 4 0 0 1.2
| , SESLESRBSSESBBLES 1b 2 © © © © ©
SeOEenrnaennonaneaoagagaredad ry ee ne ns
TSSBS222S222R RR RR H Oo & 2&2® 6 § 2 Sb
0.8 og @ £3206
Source: BofA Merrill Lynch Global Research, Office of Budgetary Source: Office of Budgetary Responsibility Source: Bloomberg
Responsibility
Certainty that Brexit negotiations will start, but uncertainty on the details
Against this debt and growth backdrop, investors are likely to want clarity and visibility
on policymaking in order to continue funding the UK’s deficit in our view. We think they
could be disappointed.
Firstly, the Government has committed to triggering Article 50 by the end of March
2017. We think this is likely irrespective of the outcome of the Judicial Review on where
the legislative power lies for making that decision. Second, the Government’s formal
position is not to announce its negotiating strategy in public. A lack of insight into the
Uk’s future trading relationship with its
HOUSE_OVERSIGHT_014485.jpg
ID: 9450
Description:
Pages: 1
OCR done: 1
Downloaded: 1
OCR updated: 2026-04-09 10:24:58
Source status: needs_review
Local path: /HOUSE_OVERSIGHT_FILES/HOUSE_OVERSIGHT_014485.jpg
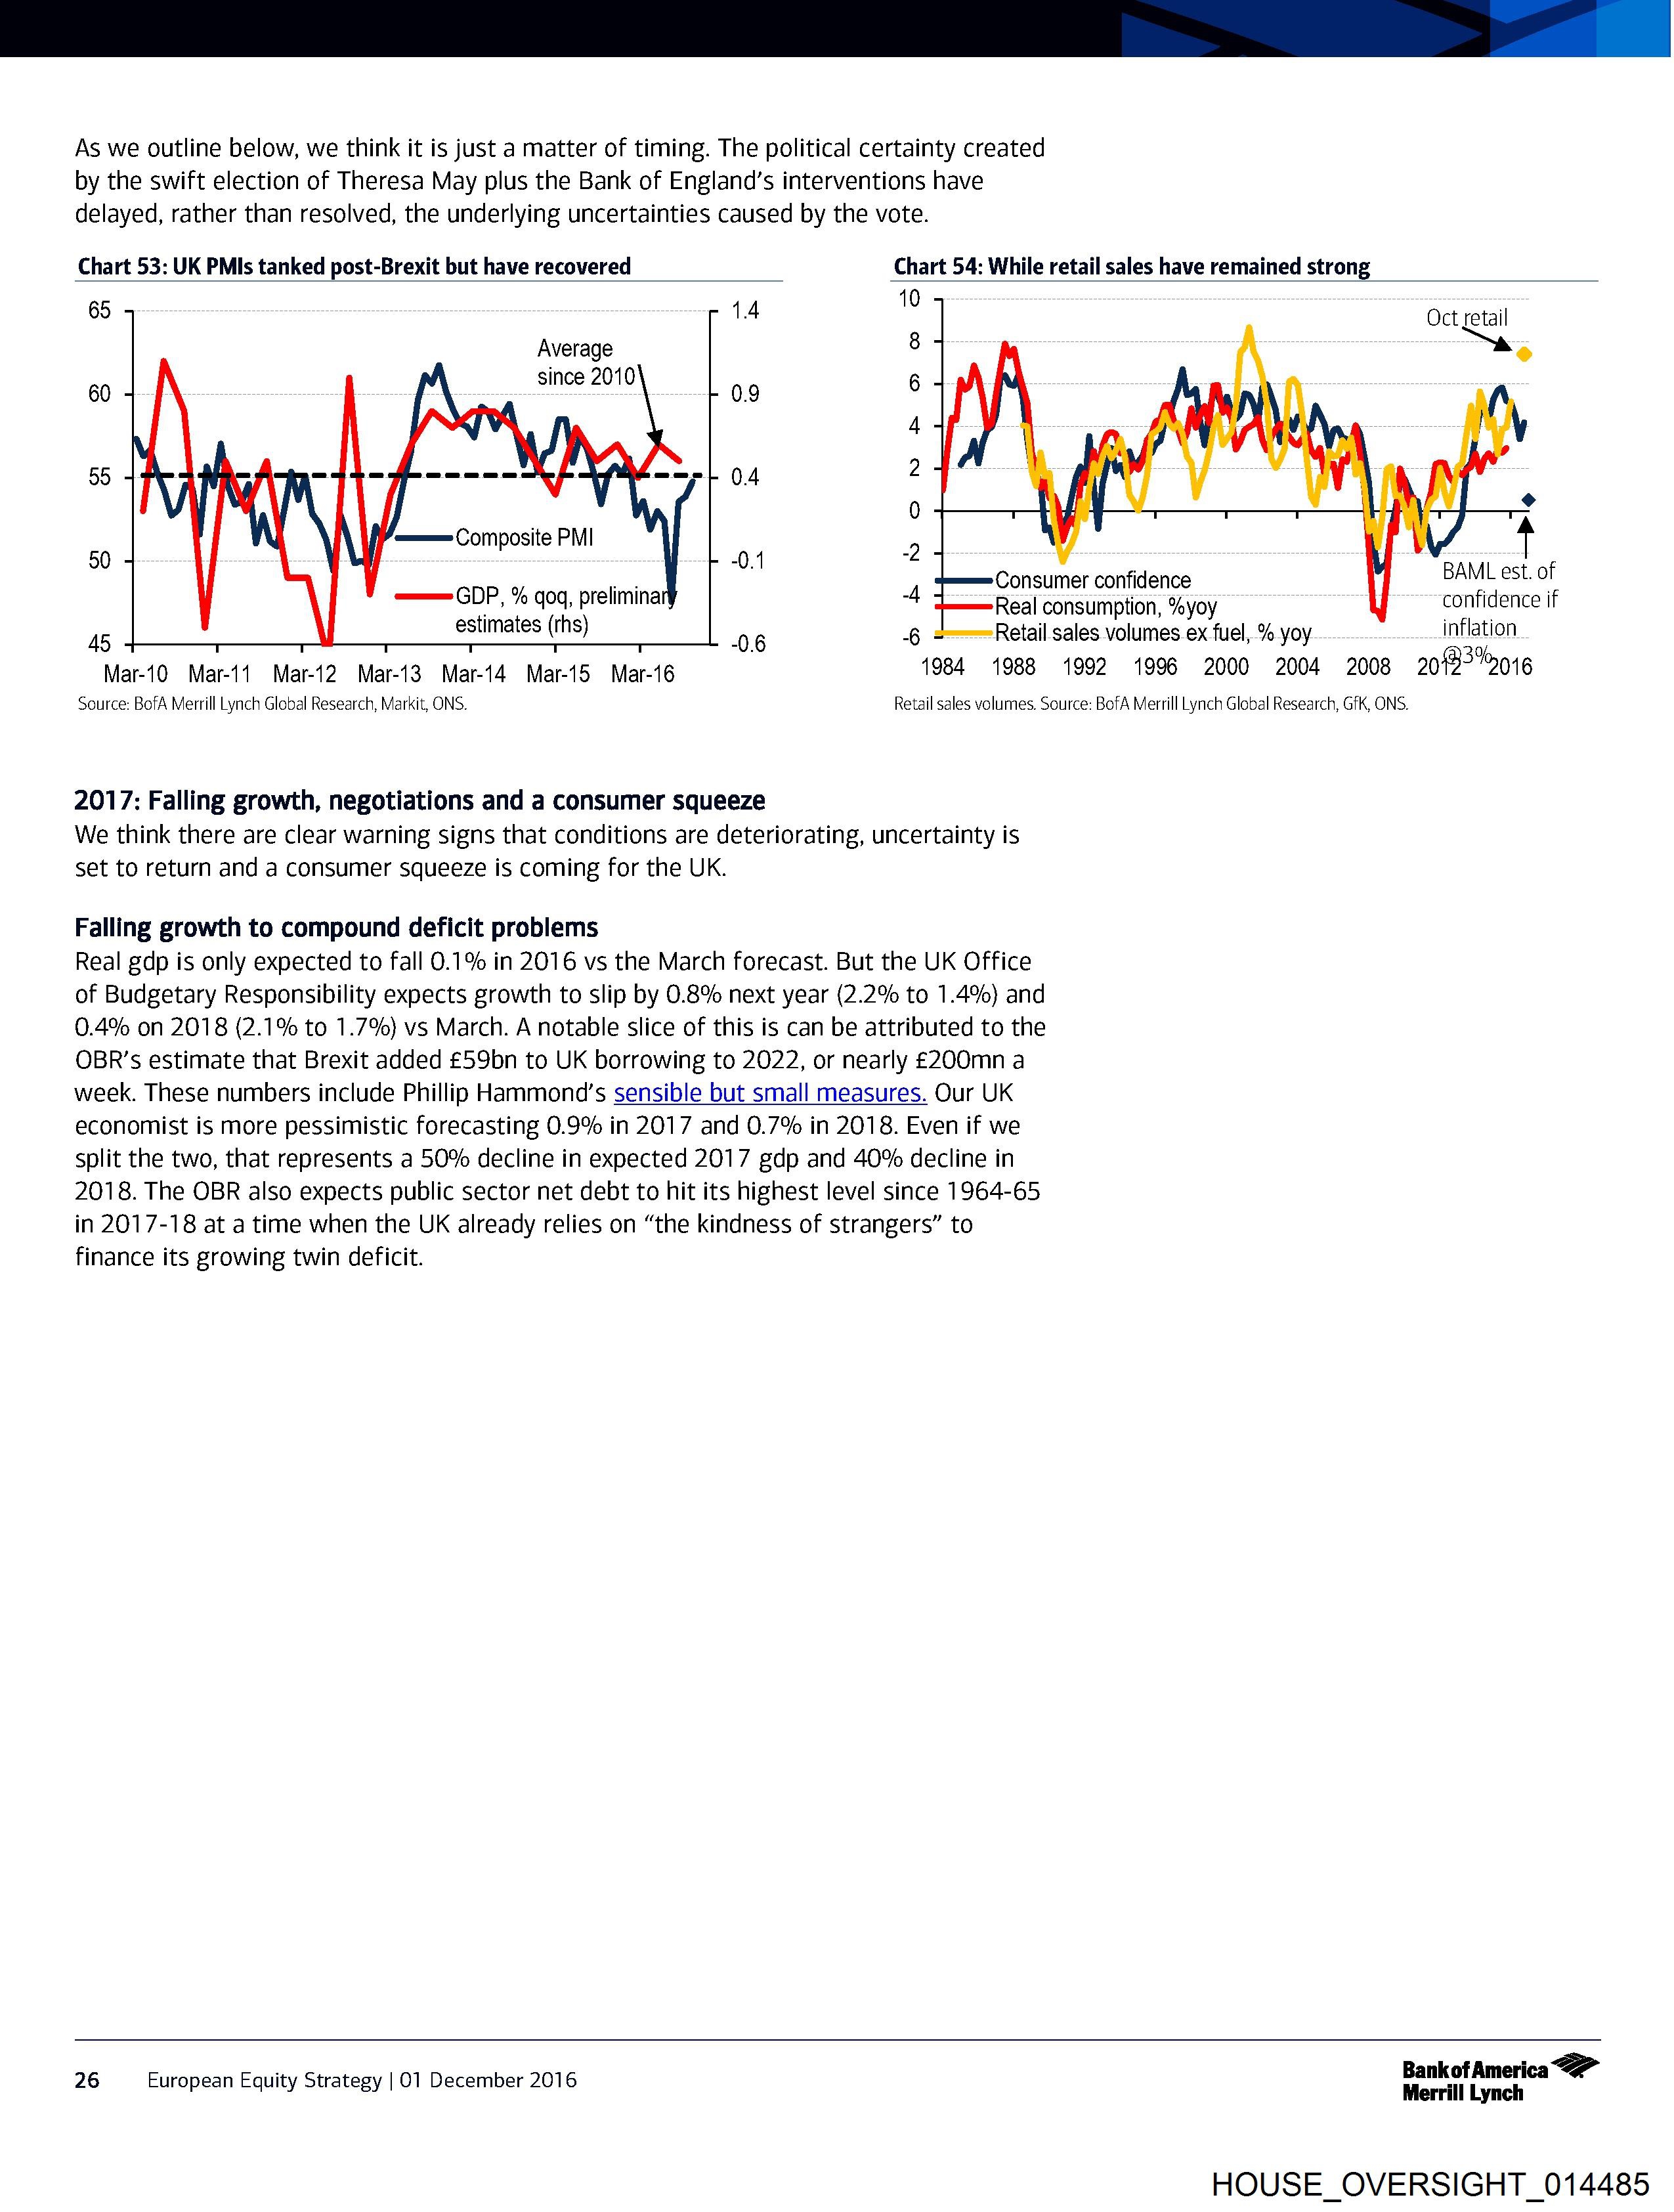
As we outline below, we think it is just a matter of timing. The political certainty created
by the swift election of Theresa May plus the Bank of England’s interventions have
delayed, rather than resolved, the underlying uncertainties caused by the vote.
Chart 53: UK PMls tanked post-Brexit but have recovered
Chart 54: While retail sales have remained strong
10
°° i Oct retail
Average 8 a
60 since 2010 09 6 f
55 JPR ANRGA PA 11 pie———l 0.4 2 v pr
50 Composite PMI 54 » \ |
0 - Consumer confidence BAML est. of
| op % qoq, prelimina -4 Real consumption, %yoy confidence if
45 eslimales (ths) 06 6 =—=Retail sales volumes.ex fuel, % yoy inflation
Mar-10 Mar-11 Mar-12 Mar-13 Mar-14 Mar-15 Mar-16
Source: BofA Merrill Lynch Global Research, Markit, ONS.
2017: Falling growth, negotiations and a consumer squeeze
We think there are clear warning signs that conditions are deteriorating, uncertainty is
set to return and a consumer squeeze is coming for the UK.
Falling growth to compound deficit problems
Real gdp is only expected to fall 0.1% in 2016 vs the March forecast. But the UK Office
of Budgetary Responsibility expects growth to slip by 0.8% next year (2.2% to 1.4%) and
0.4% on 2018 (2.1% to 1.7%} vs March. A notable slice of this is can be attributed to the
OBR’s estimate that Brexit added £59bn to UK borrowing to 2022, or nearly £200mn a
week. These numbers include Phillip Hammond’s sensible but small measures. Our UK
economist is more pessimistic forecasting 0.9% in 2017 a
HOUSE_OVERSIGHT_014484.jpg
ID: 9449
Description:
Pages: 1
OCR done: 1
Downloaded: 1
OCR updated: 2026-04-09 10:24:55
Source status: needs_review
Local path: /HOUSE_OVERSIGHT_FILES/HOUSE_OVERSIGHT_014484.jpg
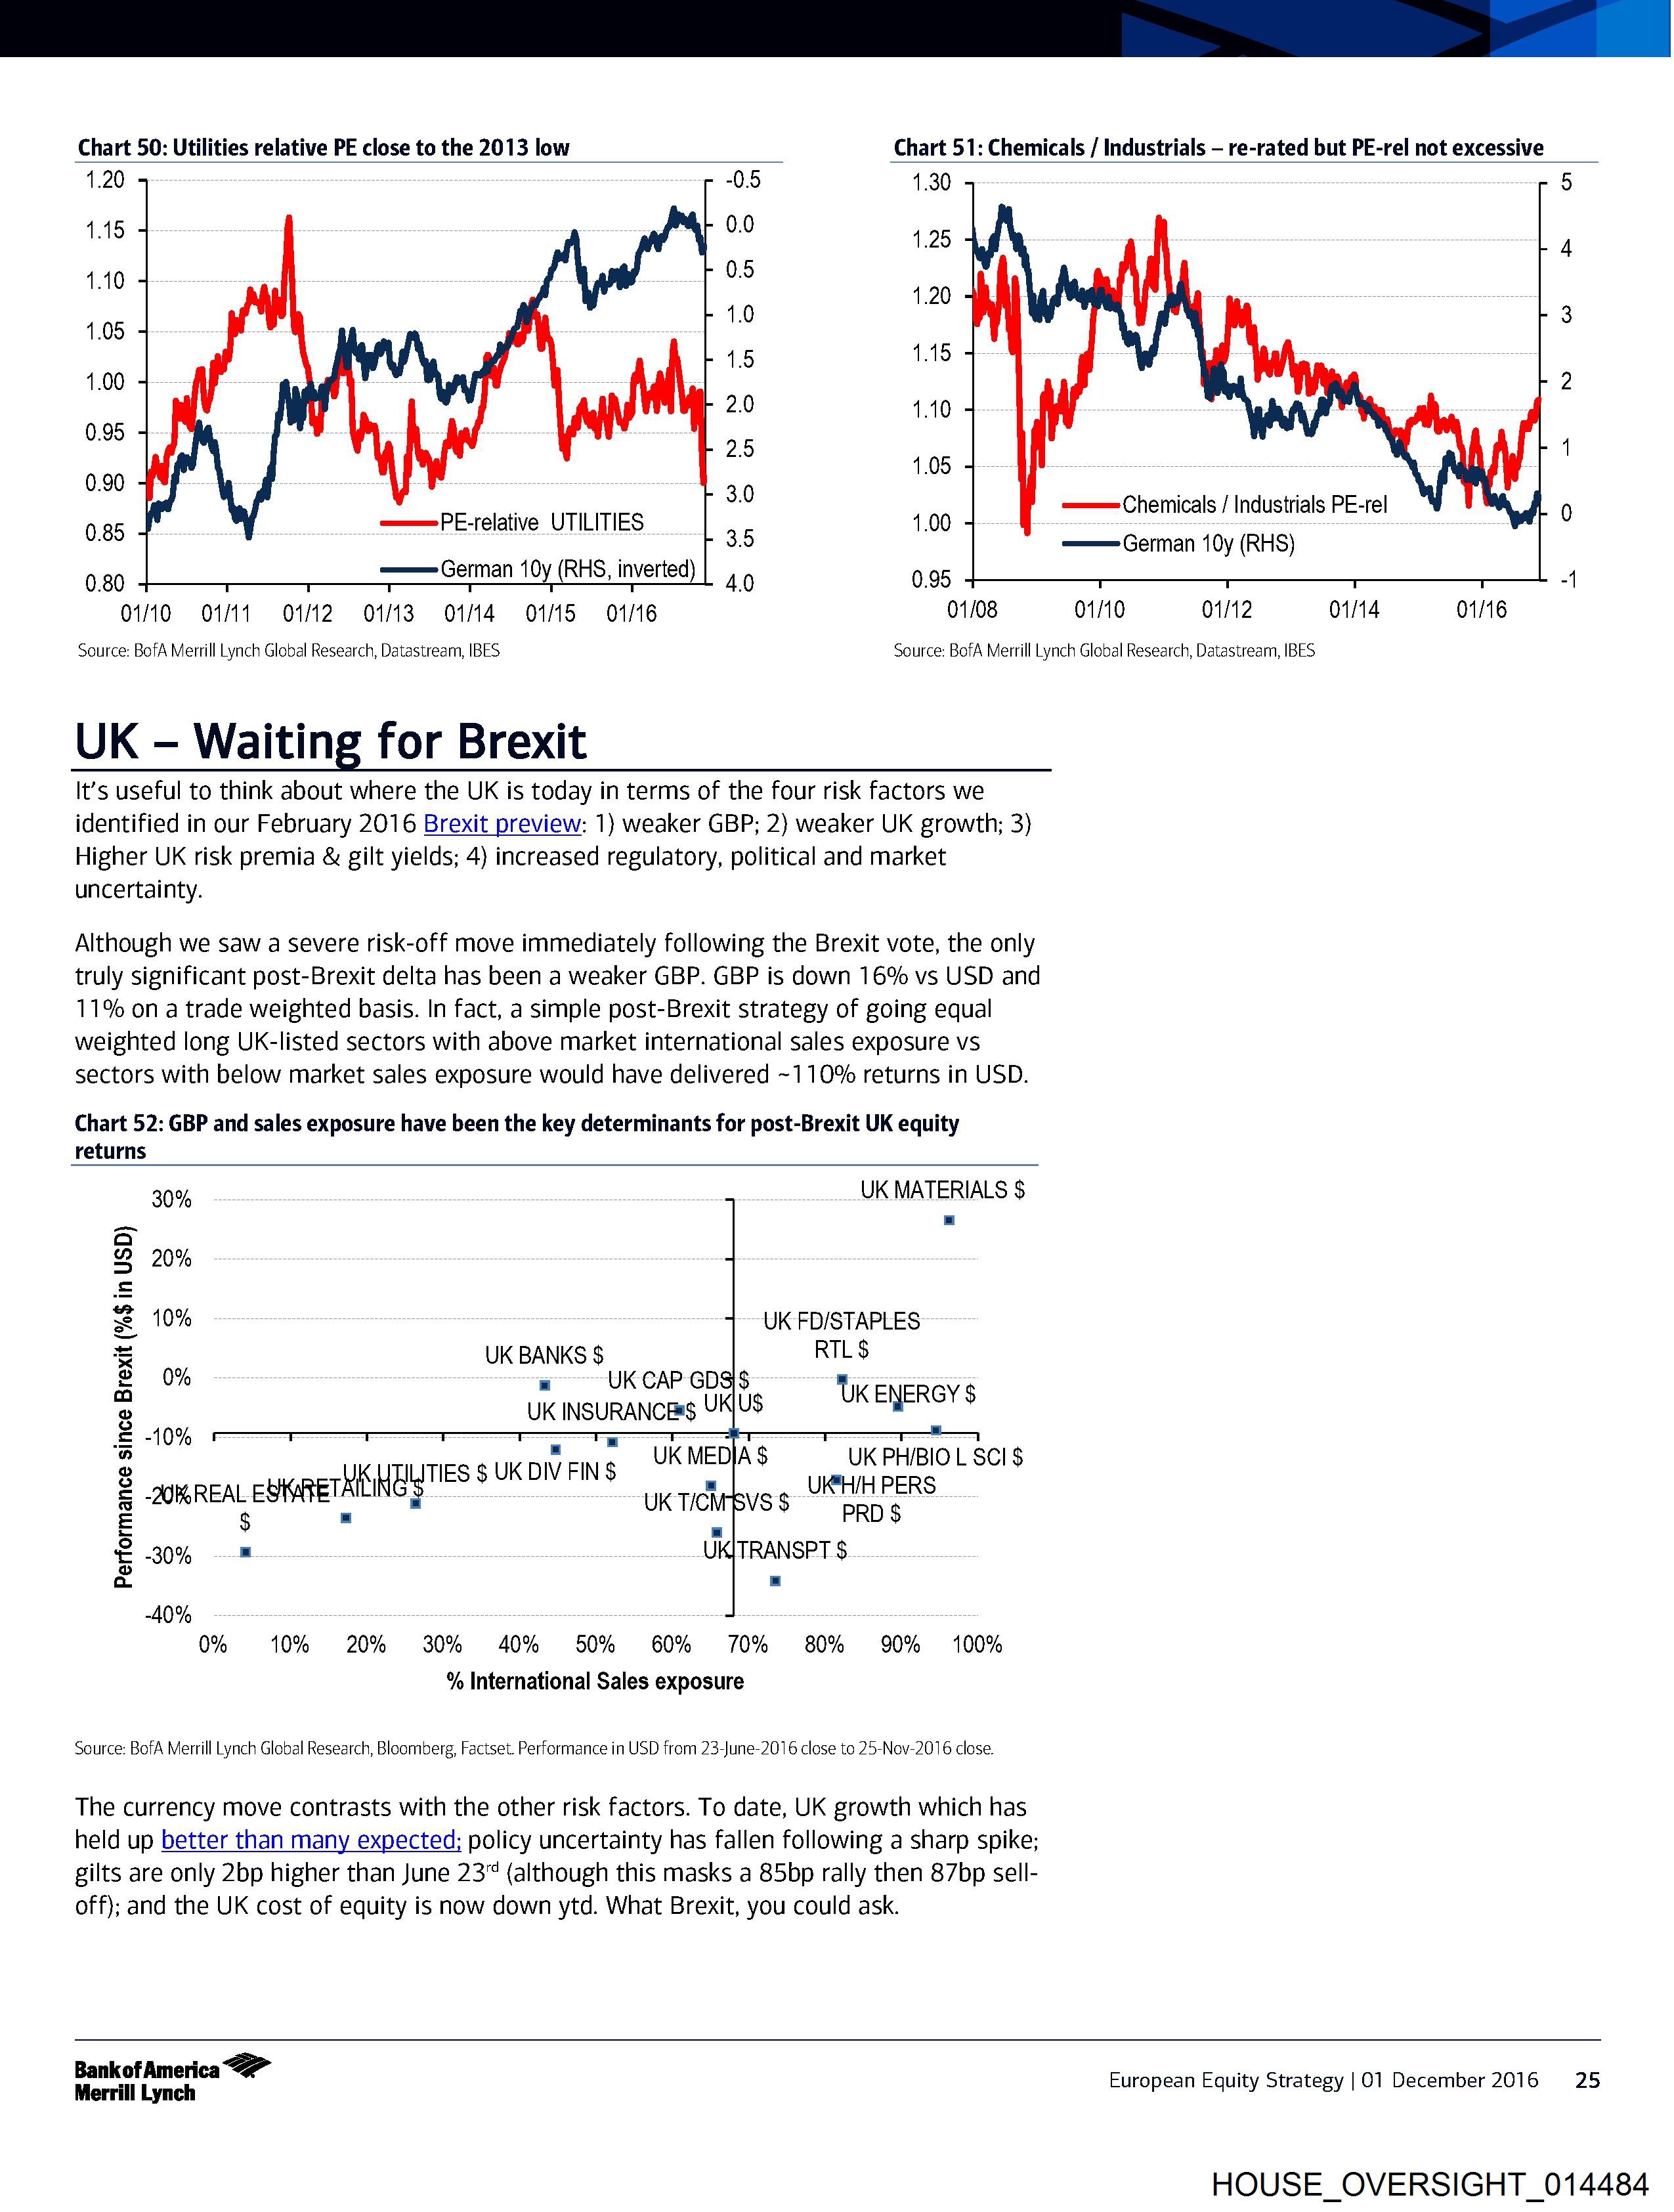
Chart 50: Utilities relative PE close to the 2013 low Chart 51: Chemicals / Industrials — re-rated but PE-rel not excessive
1.20 -0.5 1.30
1.15 0.0 195
0.5
1.10 i 120
) 15 1.19
1.00
| 2.0 1.10
0.95 : s : 25
1.05
290 3.0 Chemicals / Industrials PE-rel
ess iNemicals / Industrials FrE-re
0.85 ——PE-telative UTILITIES 1.00
: | 3.9 ———= (German 10y (RHS)
0.80 e=e—= (German 10y (RHS, inverted) 40 0.95
01/10 O1/11 O1f92 01/138 O1f4 O1/15 O1/16 01/08 01/10 01/12 01/14 01/16
Source: BofA Merrill Lynch Global Research, Datastream, IBES Source: BofA Merrill Lynch Global Research, Datastream, IBES
UK -— Waiting for Brexit
It’s useful to think about where the UK is today in terms of the four risk factors we
identified in our February 2016 Brexit preview: 1) weaker GBP; 2) weaker UK growth; 3)
Higher UK risk premia & gilt yields; 4) increased regulatory, political and market
uncertainty.
Although we saw a severe risk-off move immediately following the Brexit vote, the only
truly significant post-Brexit delta has been a weaker GBP. GBP is down 16% vs USD and
11% on a trade weighted basis. In fact, a simple post-Brexit strategy of going equal
weighted long UK-listed sectors with above market international sales exposure vs
sectors with below market sales exposure would have delivered ~110% returns in USD.
Chart 52: GBP and sales exposure have been the key determinants for post-Brexit UK equity
returns
30% UK MATERIALS $
a
PD 20%
=
= 10% UK FD/STAPLES
Boy UK BANKS $ RTL $
Ss « UK CAP-GD
HOUSE_OVERSIGHT_014483.jpg
ID: 9448
Description:
Pages: 1
OCR done: 1
Downloaded: 1
OCR updated: 2026-04-09 10:24:53
Source status: needs_review
Local path: /HOUSE_OVERSIGHT_FILES/HOUSE_OVERSIGHT_014483.jpg
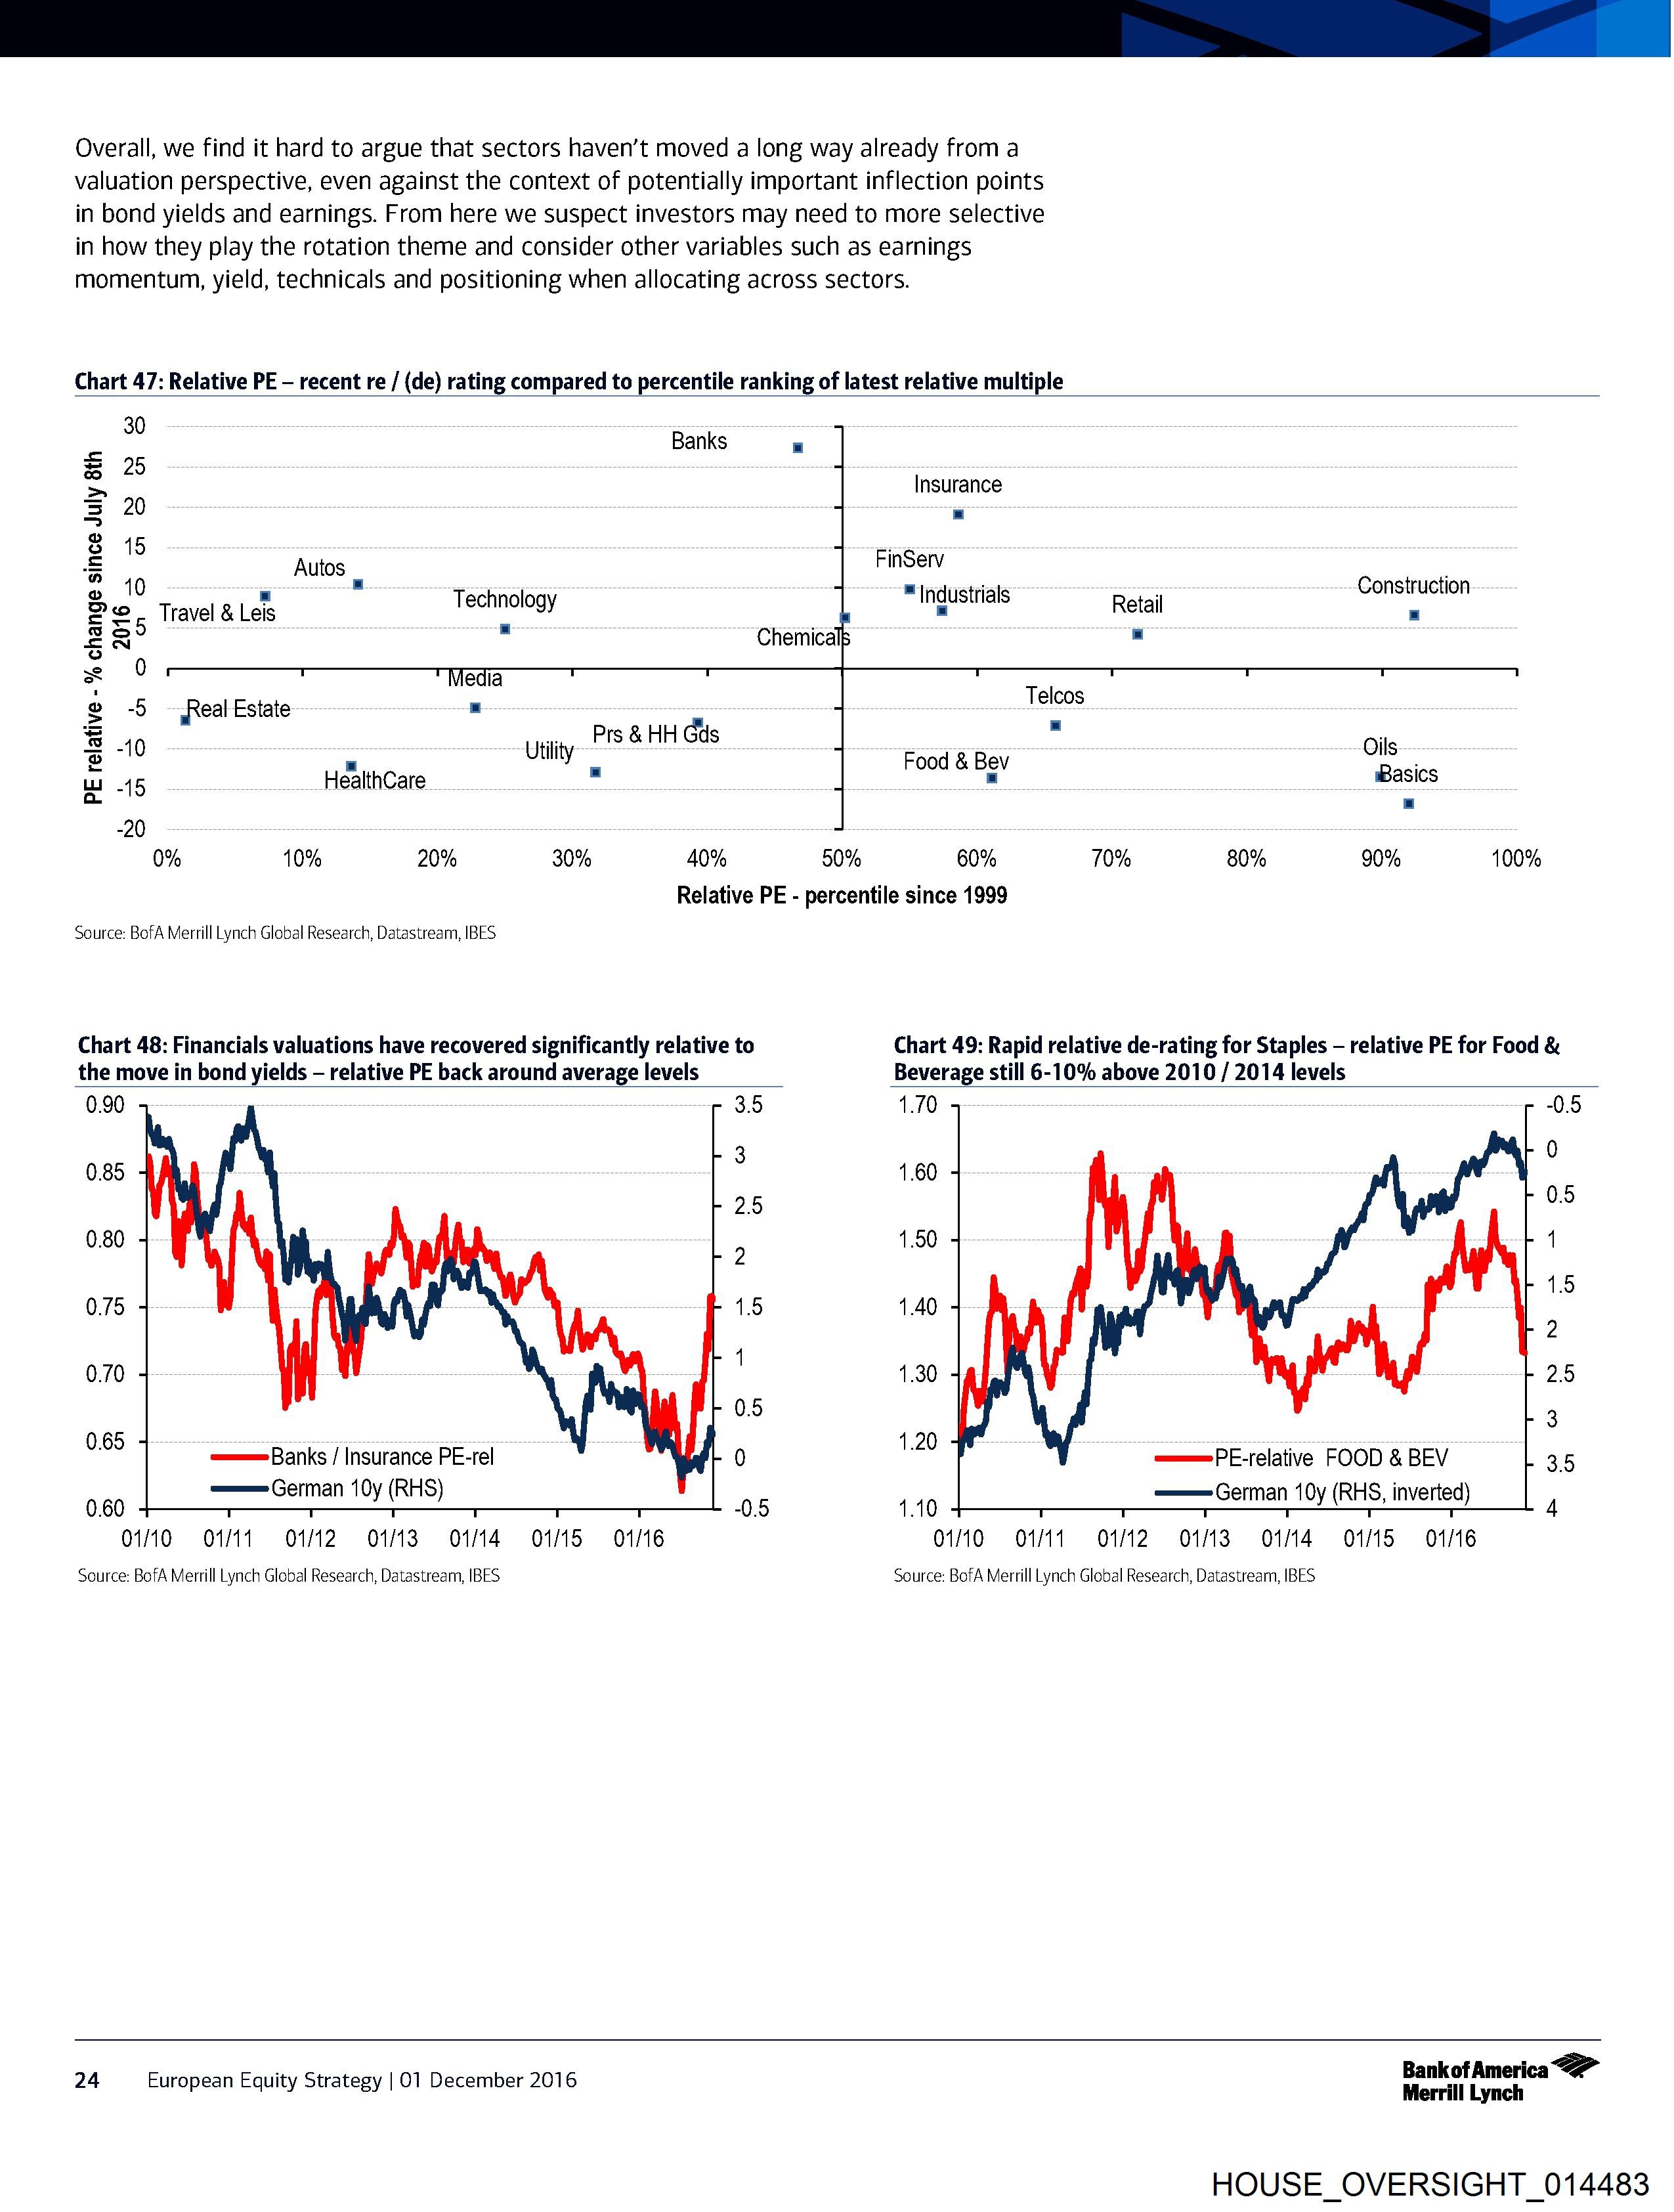
Overall, we find it hard to argue that sectors haven’t moved a long way already from a
valuation perspective, even against the context of potentially important inflection points
in bond yields and earnings. From here we suspect investors may need to more selective
in how they play the rotation theme and consider other variables such as earnings
momentum, yield, technicals and positioning when allocating across sectors.
Chart 47: Relative PE - recent re / (de) rating compared to percentile ranking of latest relative multiple
30
Autos
Technology
iy
Travel & Leis
yreal Estate é
40 Utility Prs & HH Gds
|
45 HealthCare
PE relative - % change since July 8th
0% 10% 20% 30% 40%
a
Insurance
|
FinServ
7 Industrials Retail Construction
=
Telcos
=
Oils
Food & Bev wWasics
|
60% 10% 80% 90% 100%
Relative PE - percentile since 1999
Source: BofA Merrill Lynch Global Research, Datastream, IBES
Chart 48: Financials valuations have recovered significantly relative to
the move in bond yields — relative PE back around average levels
0.90 3.5
0.85 :
2.5
0.80
2
0.75 1.5
0.70
0.5
on ex Banks / Insurance PE-rel 0
exe German 10y (RHS)
0.60 -0.5
01/10 O1/11 O12 O1f38 O1f4 01/15 01/16
Source: BofA Merrill Lynch Global Research, Datastream, IBES
24 European Equity Strategy | 01 December 2016
Chart 49: Rapid relative de-rating for Staples - relative PE for Food &
Beverage still 6-10% above 2010 / 2014 levels
1.70 -0.5
0
1.60
0.5
1.50 |
1.5
1.40
2
1.30 2.5
3
1.20
e====—=PE-relative FO
HOUSE_OVERSIGHT_014482.jpg
ID: 9447
Description:
Pages: 1
OCR done: 1
Downloaded: 1
OCR updated: 2026-04-09 10:24:51
Source status: needs_review
Local path: /HOUSE_OVERSIGHT_FILES/HOUSE_OVERSIGHT_014482.jpg
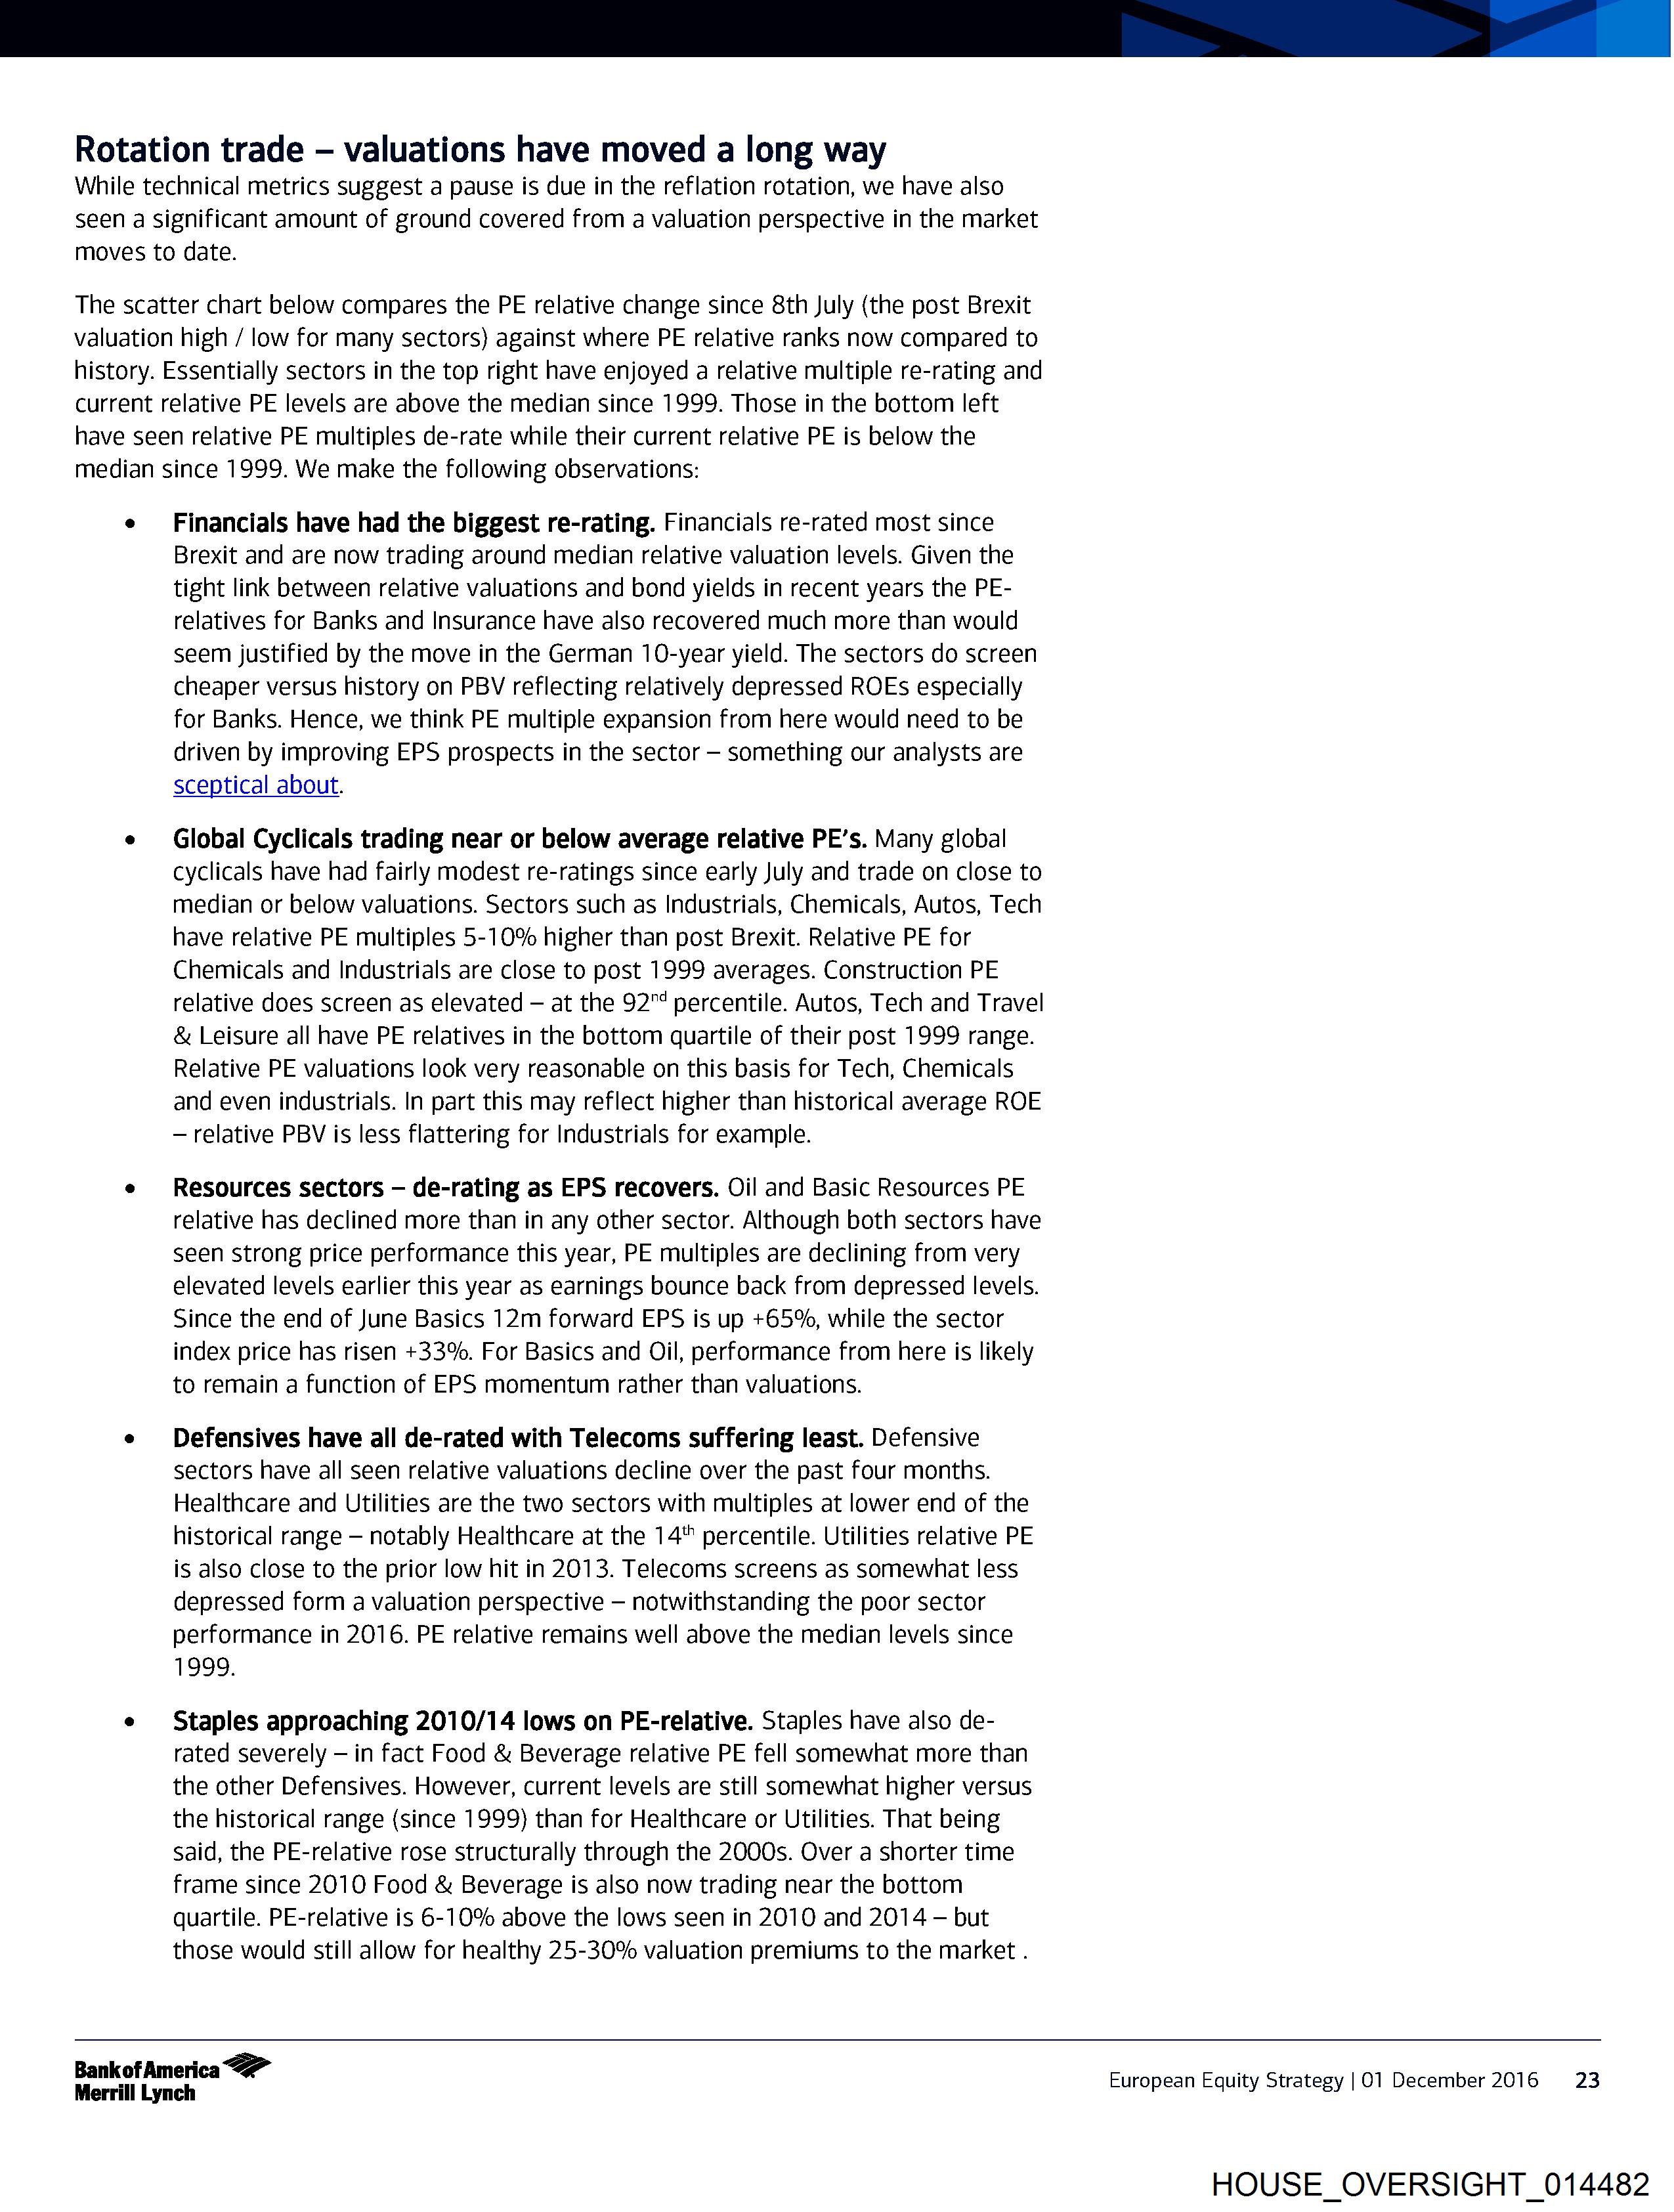
Rotation trade — valuations have moved a long way
While technical metrics suggest a pause is due in the reflation rotation, we have also
seen a Significant amount of ground covered from a valuation perspective in the market
moves to date.
The scatter chart below compares the PE relative change since 8th July (the post Brexit
valuation high / low for many sectors) against where PE relative ranks now compared to
history. Essentially sectors in the top right have enjoyed a relative multiple re-rating and
current relative PE levels are above the median since 1999. Those in the bottom left
have seen relative PE multiples de-rate while their current relative PE is below the
median since 1999. We make the following observations:
e Financials have had the biggest re-rating. Financials re-rated most since
Brexit and are now trading around median relative valuation levels. Given the
tight link between relative valuations and bond yields in recent years the PE-
relatives for Banks and Insurance have also recovered much more than would
seem justified by the move in the German 10-year yield. The sectors do screen
cheaper versus history on PBV reflecting relatively depressed ROEs especially
for Banks. Hence, we think PE multiple expansion from here would need to be
driven by improving EPS prospects in the sector — something our analysts are
sceptical about.
e Global Cyclicals trading near or below average relative PE’s. Many global
cyclicals have had fairly modest re-ratings since ear
HOUSE_OVERSIGHT_014481.jpg
ID: 9446
Description:
Pages: 1
OCR done: 1
Downloaded: 1
OCR updated: 2026-04-09 10:24:48
Source status: needs_review
Local path: /HOUSE_OVERSIGHT_FILES/HOUSE_OVERSIGHT_014481.jpg
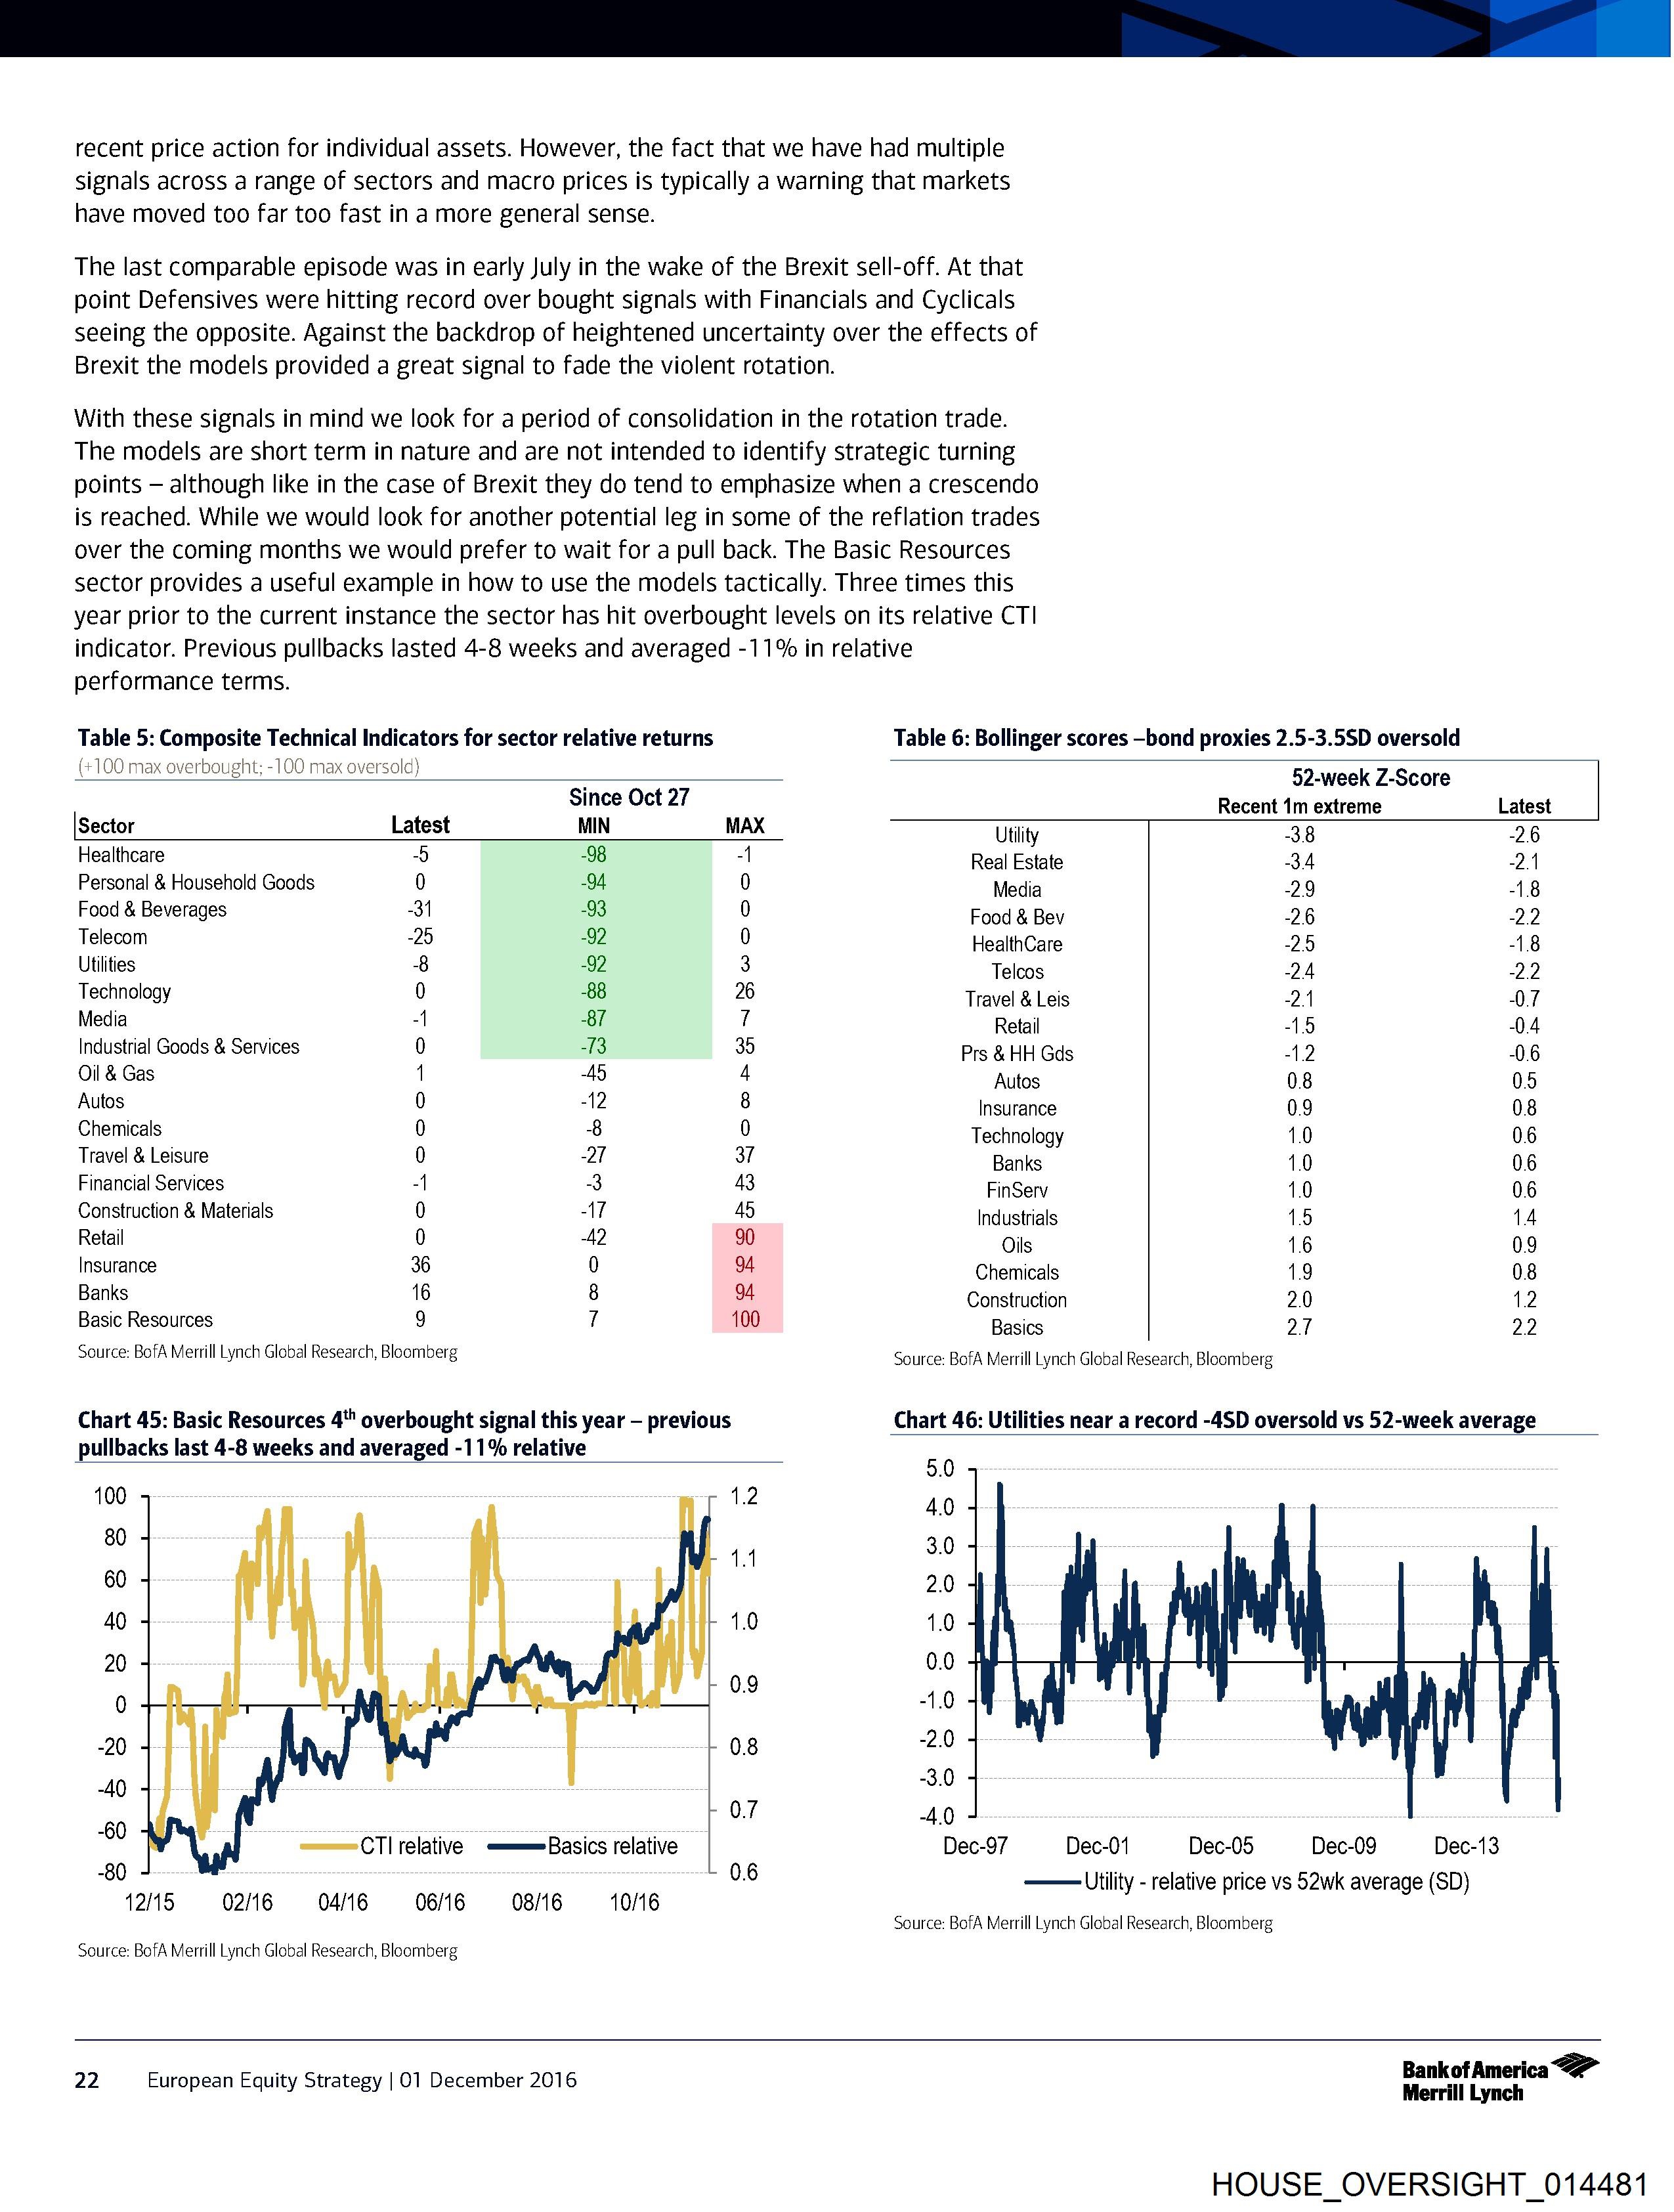
recent price action for individual assets. However, the fact that we have had multiple
Signals across a range of sectors and macro prices is typically a warning that markets
have moved too far too fast in a more general sense.
The last comparable episode was in early July in the wake of the Brexit sell-off. At that
point Defensives were hitting record over bought signals with Financials and Cyclicals
seeing the opposite. Against the backdrop of heightened uncertainty over the effects of
Brexit the models provided a great signal to fade the violent rotation.
With these signals in mind we look for a period of consolidation in the rotation trade.
The models are short term in nature and are not intended to identify strategic turning
points — although like in the case of Brexit they do tend to emphasize when a crescendo
is reached. While we would look for another potential leg in some of the reflation trades
over the coming months we would prefer to wait for a pull back. The Basic Resources
sector provides a useful example in how to use the models tactically. Three times this
year prior to the current instance the sector has hit overbought levels on its relative CT|
indicator. Previous pullbacks lasted 4-8 weeks and averaged -11% in relative
performance terms.
Table 5: Composite Technical Indicators for sector relative returns Table 6: Bollinger scores —bond proxies 2.5-3.5SD oversold
(+100 max overbought; -100 max oversold) 52-week Z-Score
Since Oct 27 Recent 1m extreme Latest
HOUSE_OVERSIGHT_014480.jpg
ID: 9445
Description:
Pages: 1
OCR done: 1
Downloaded: 1
OCR updated: 2026-04-09 10:24:45
Source status: needs_review
Local path: /HOUSE_OVERSIGHT_FILES/HOUSE_OVERSIGHT_014480.jpg
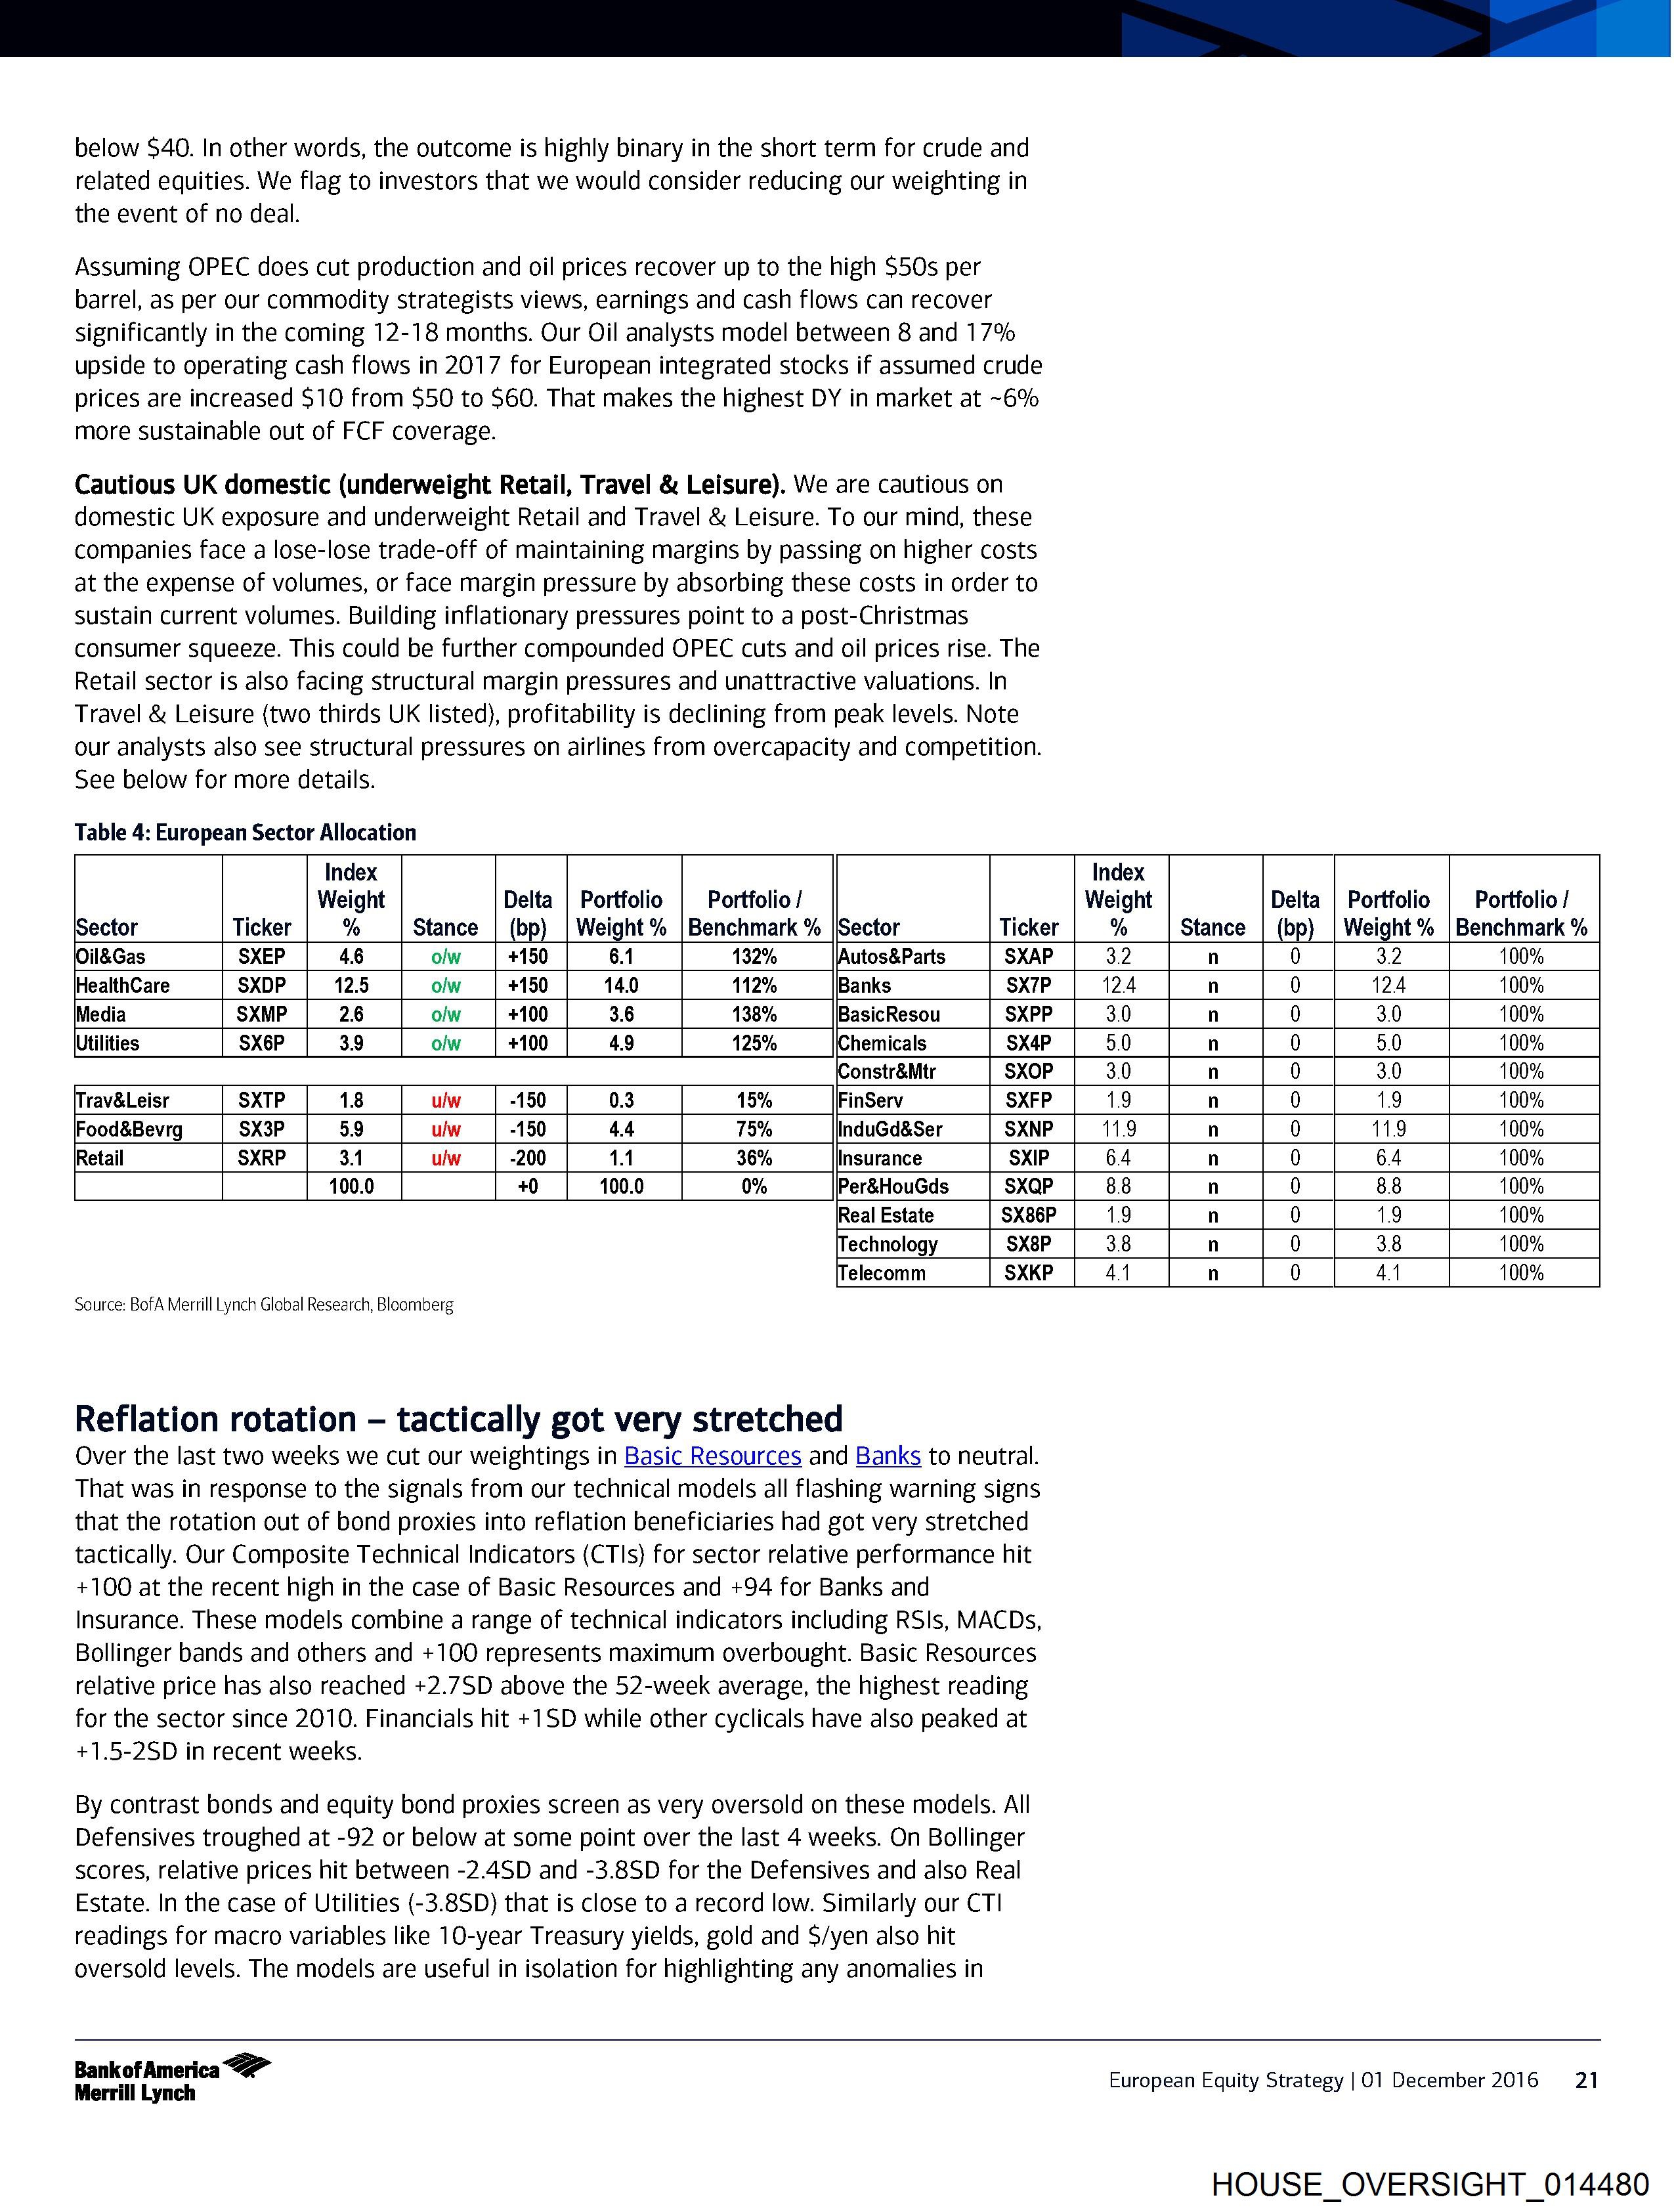
below $40. In other words, the outcome is highly binary in the short term for crude and
related equities. We flag to investors that we would consider reducing our weighting in
the event of no deal.
Assuming OPEC does cut production and oil prices recover up to the high $50s per
barrel, as per our commodity strategists views, earnings and cash flows can recover
significantly in the coming 12-18 months. Our Oil analysts model between 8 and 17%
upside to operating cash flows in 2017 for European integrated stocks if assumed crude
prices are increased $10 from $50 to $60. That makes the highest DY in market at ~6%
more sustainable out of FCF coverage.
Cautious UK domestic (underweight Retail, Travel & Leisure). We are cautious on
domestic UK exposure and underweight Retail and Travel & Leisure. To our mind, these
companies face a lose-lose trade-off of maintaining margins by passing on higher costs
at the expense of volumes, or face margin pressure by absorbing these costs in order to
sustain current volumes. Building inflationary pressures point to a post-Christmas
consumer squeeze. This could be further compounded OPEC cuts and oil prices rise. The
Retail sector is also facing structural margin pressures and unattractive valuations. In
Travel & Leisure (two thirds UK listed), profitability is declining from peak levels. Note
our analysts also see structural pressures on airlines from overcapacity and competition.
See below for more details.
Table 4: European Sector Allocatio
HOUSE_OVERSIGHT_014479.jpg
ID: 9444
Description:
Pages: 1
OCR done: 1
Downloaded: 1
OCR updated: 2026-04-09 10:24:42
Source status: needs_review
Local path: /HOUSE_OVERSIGHT_FILES/HOUSE_OVERSIGHT_014479.jpg
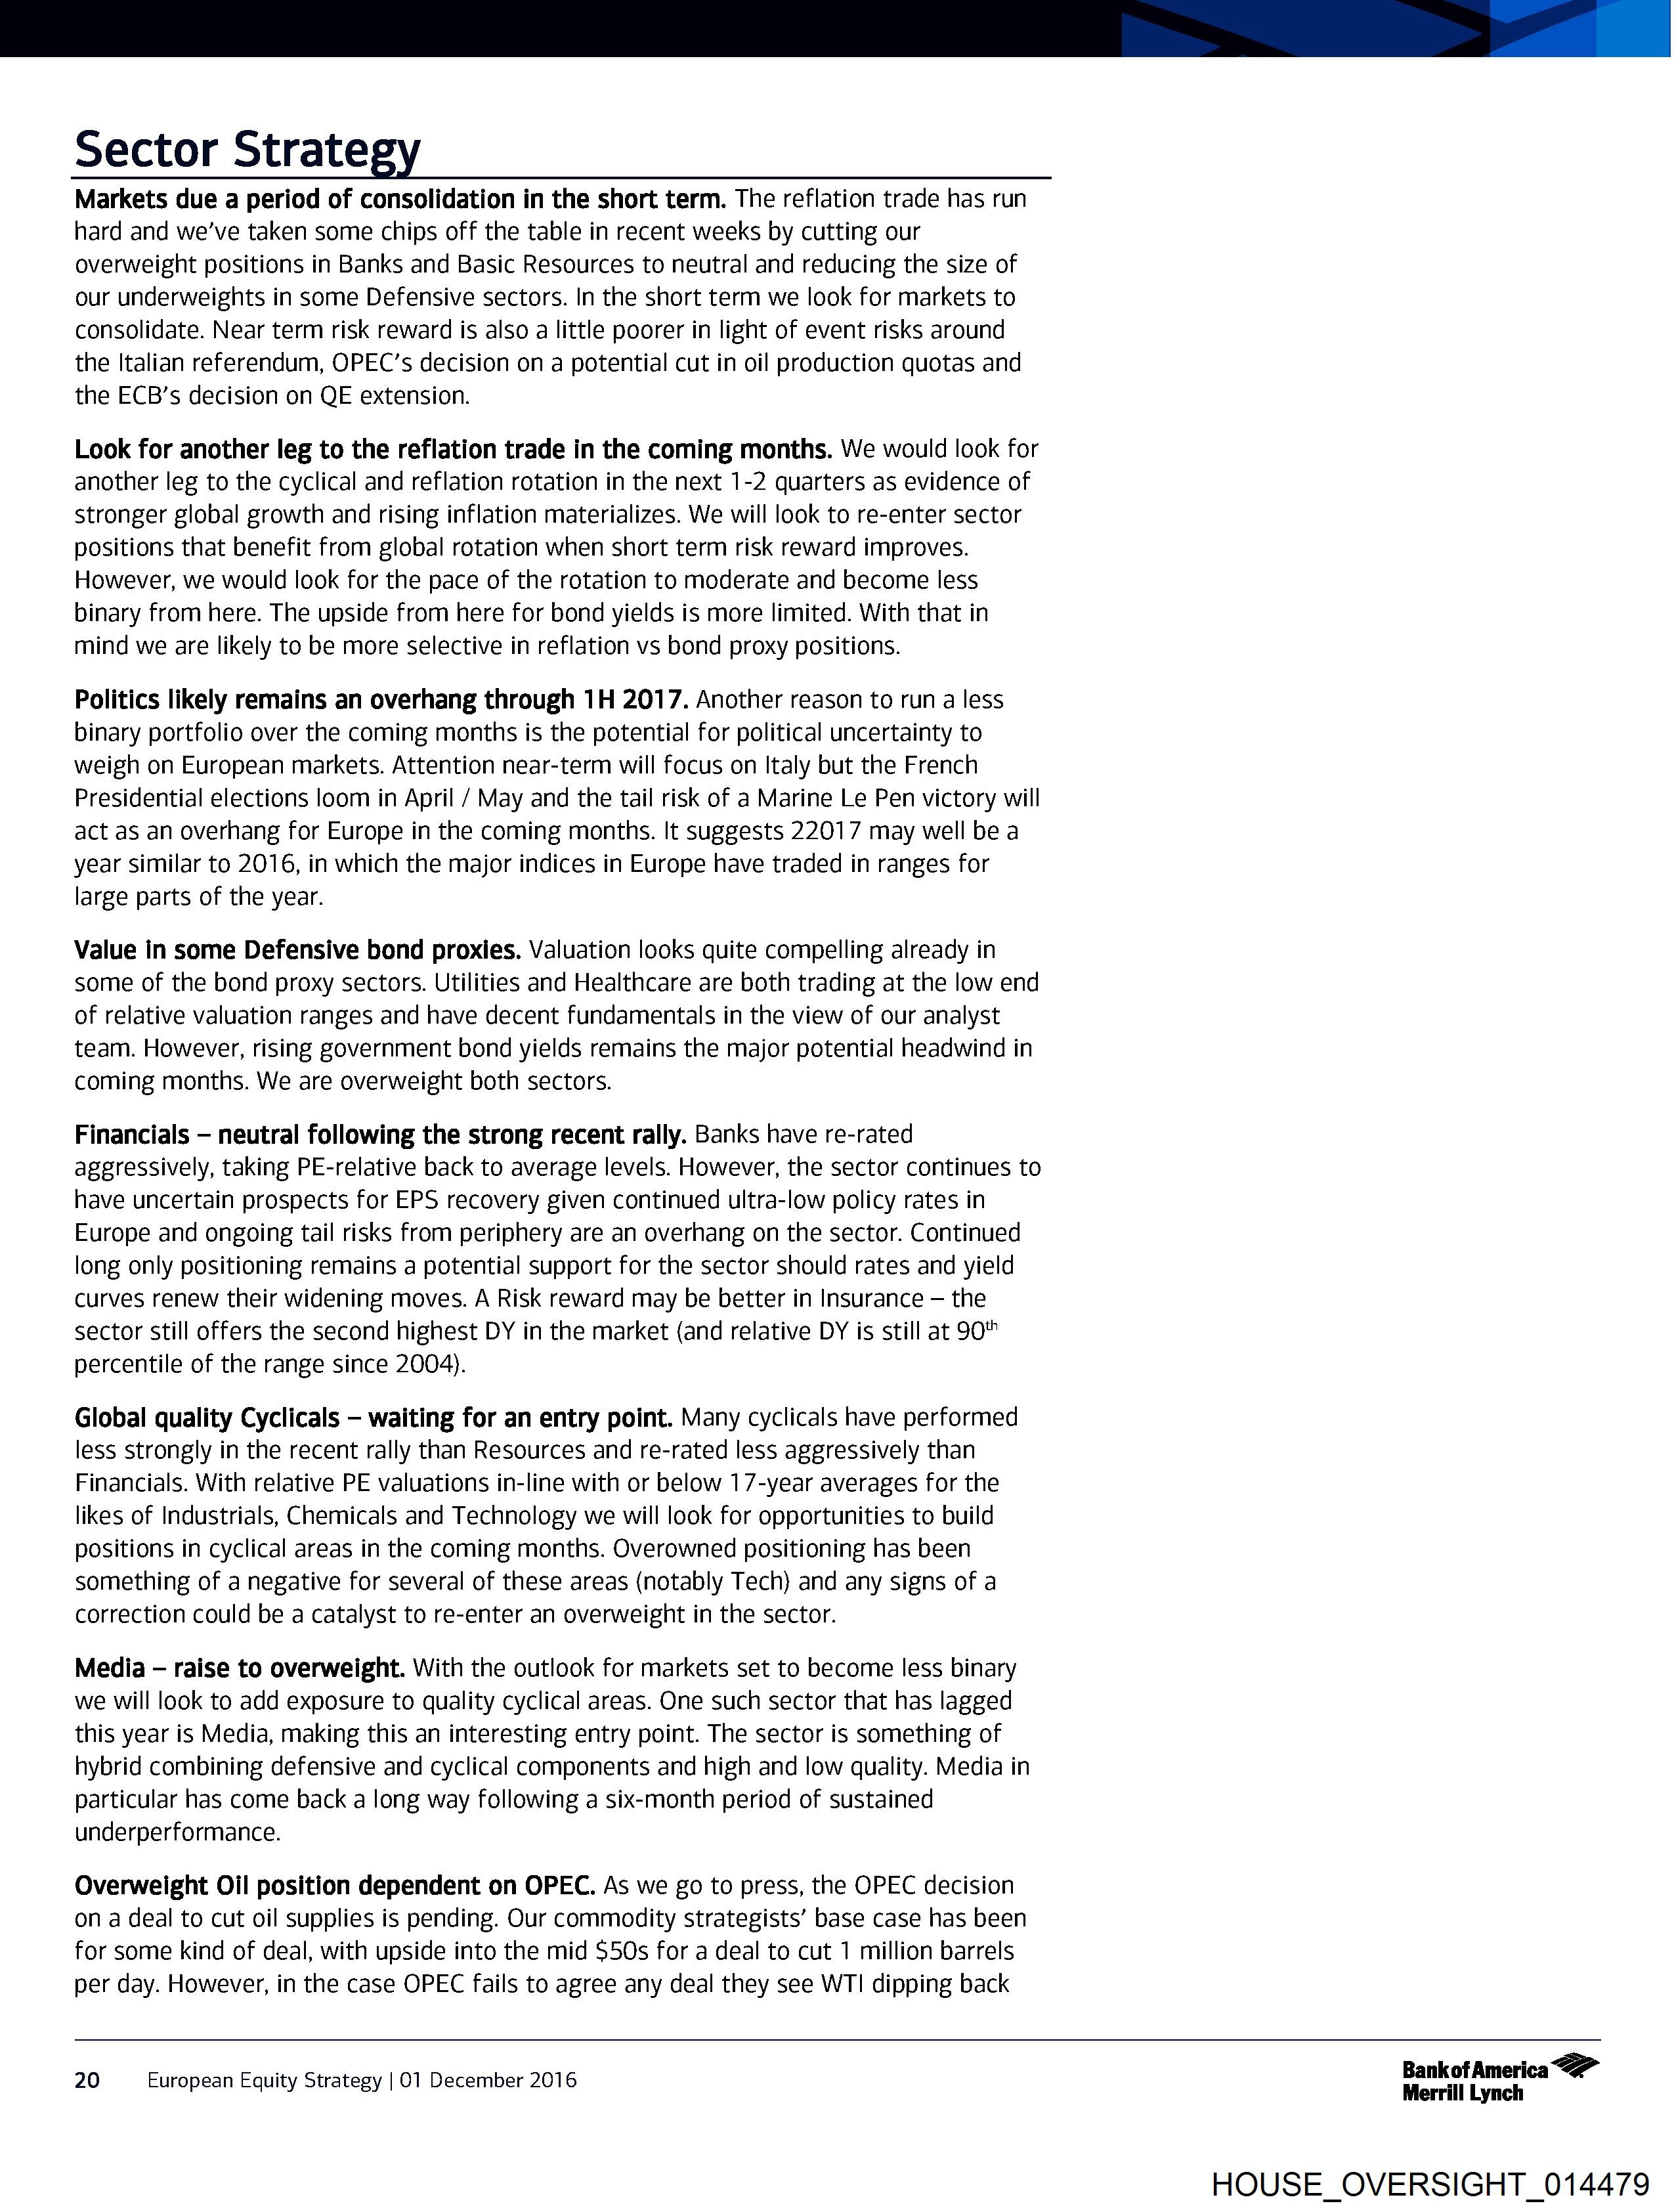
Sector Strate
Markets due a period of consolidation in the short term. The reflation trade has run
hard and we’ve taken some chips off the table in recent weeks by cutting our
overweight positions in Banks and Basic Resources to neutral and reducing the size of
our underweights in some Defensive sectors. In the short term we look for markets to
consolidate. Near term risk reward is also a little poorer in light of event risks around
the Italian referendum, OPEC’s decision on a potential cut in oil production quotas and
the ECB’s decision on QE extension.
Look for another leg to the reflation trade in the coming months. We would look for
another leg to the cyclical and reflation rotation in the next 1-2 quarters as evidence of
Stronger global growth and rising inflation materializes. We will look to re-enter sector
positions that benefit from global rotation when short term risk reward improves.
However, we would look for the pace of the rotation to moderate and become less
binary from here. The upside from here for bond yields is more limited. With that in
mind we are likely to be more selective in reflation vs bond proxy positions.
Politics likely remains an overhang through 1H 2017. Another reason to run a less
binary portfolio over the coming months is the potential for political uncertainty to
weigh on European markets. Attention near-term will focus on Italy but the French
Presidential elections loom in April / May and the tail risk of a Marine Le Pen victory will
act
HOUSE_OVERSIGHT_014478.jpg
ID: 9443
Description:
Pages: 1
OCR done: 1
Downloaded: 1
OCR updated: 2026-04-09 10:24:38
Source status: needs_review
Local path: /HOUSE_OVERSIGHT_FILES/HOUSE_OVERSIGHT_014478.jpg
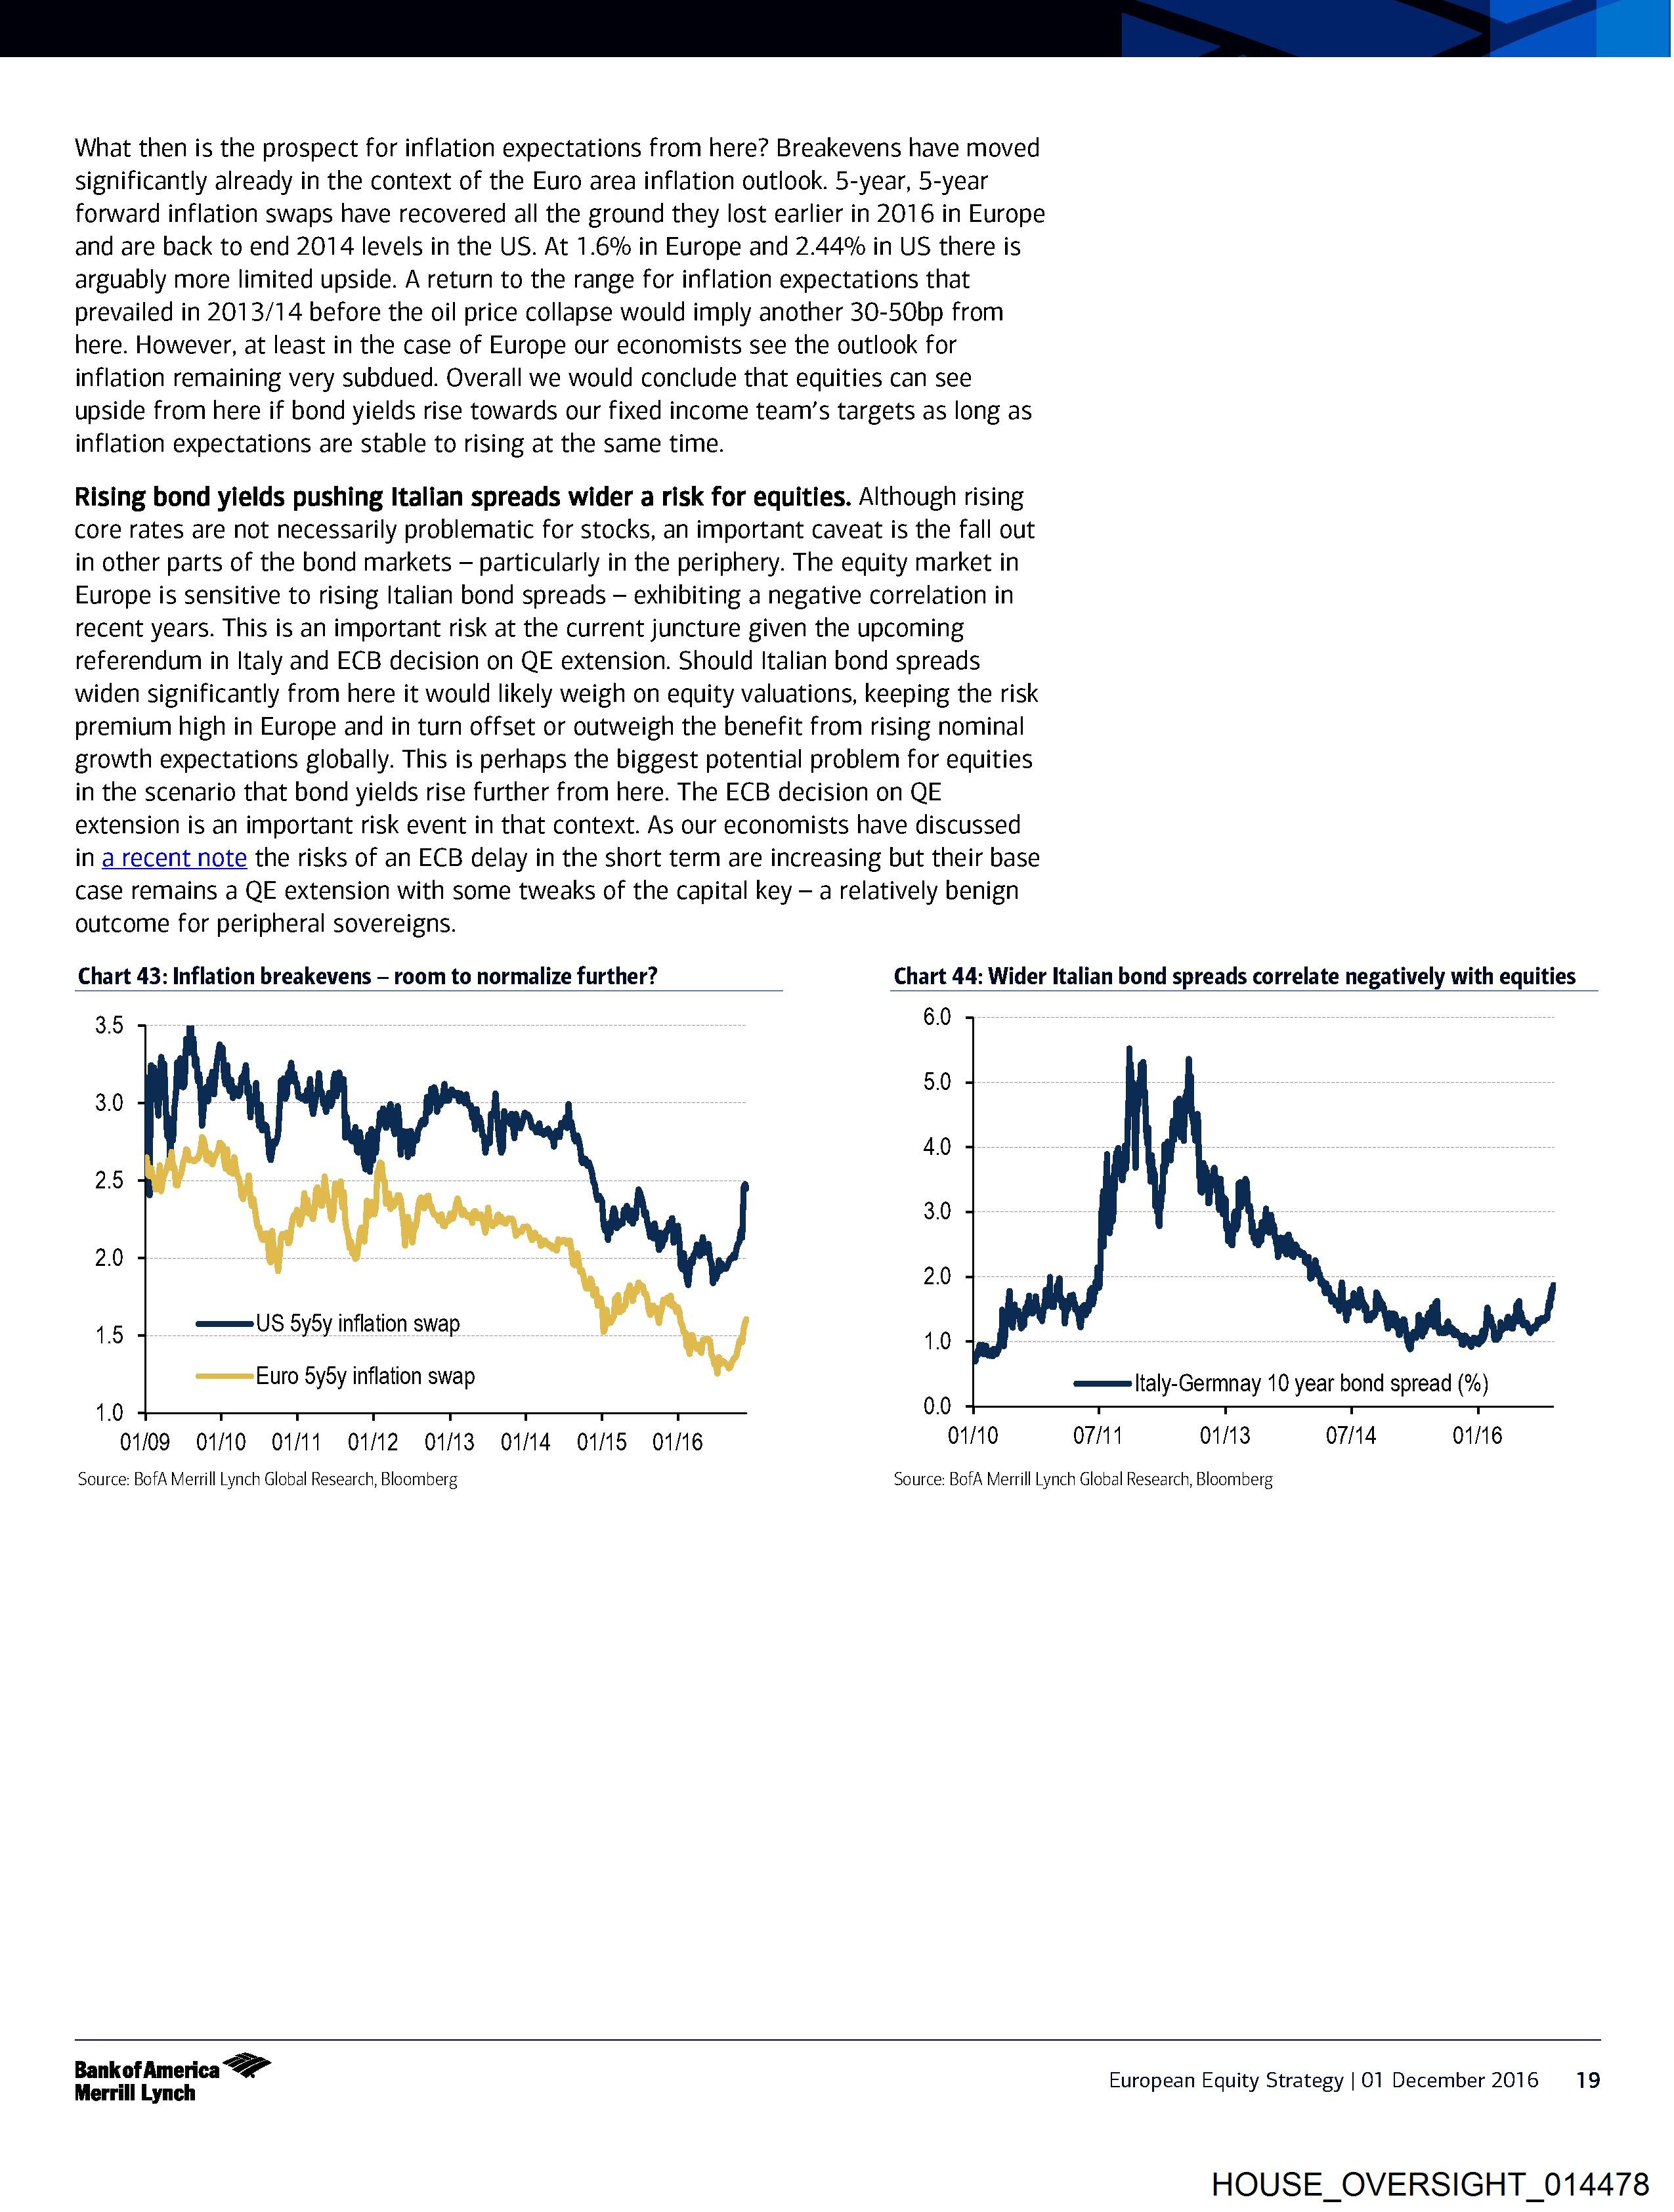
What then is the prospect for inflation expectations from here? Breakevens have moved
significantly already in the context of the Euro area inflation outlook. 5-year, 5-year
forward inflation swaps have recovered all the ground they lost earlier in 2016 in Europe
and are back to end 2014 levels in the US. At 1.6% in Europe and 2.44% in US there is
arguably more limited upside. A return to the range for inflation expectations that
prevailed in 2013/14 before the oil price collapse would imply another 30-50bp from
here. However, at least in the case of Europe our economists see the outlook for
inflation remaining very subdued. Overall we would conclude that equities can see
upside from here if bond yields rise towards our fixed income team’s targets as long as
inflation expectations are stable to rising at the same time.
Rising bond yields pushing Italian spreads wider a risk for equities. Although rising
core rates are not necessarily problematic for stocks, an important caveat is the fall out
in other parts of the bond markets — particularly in the periphery. The equity market in
Europe is sensitive to rising Italian bond spreads — exhibiting a negative correlation in
recent years. This is an important risk at the current juncture given the upcoming
referendum in Italy and ECB decision on QE extension. Should Italian bond spreads
widen significantly from here it would likely weigh on equity valuations, keeping the risk
premium high in Europe and in turn offset or outweigh th
HOUSE_OVERSIGHT_014477.jpg
ID: 9442
Description:
Pages: 1
OCR done: 1
Downloaded: 1
OCR updated: 2026-04-09 10:24:36
Source status: needs_review
Local path: /HOUSE_OVERSIGHT_FILES/HOUSE_OVERSIGHT_014477.jpg
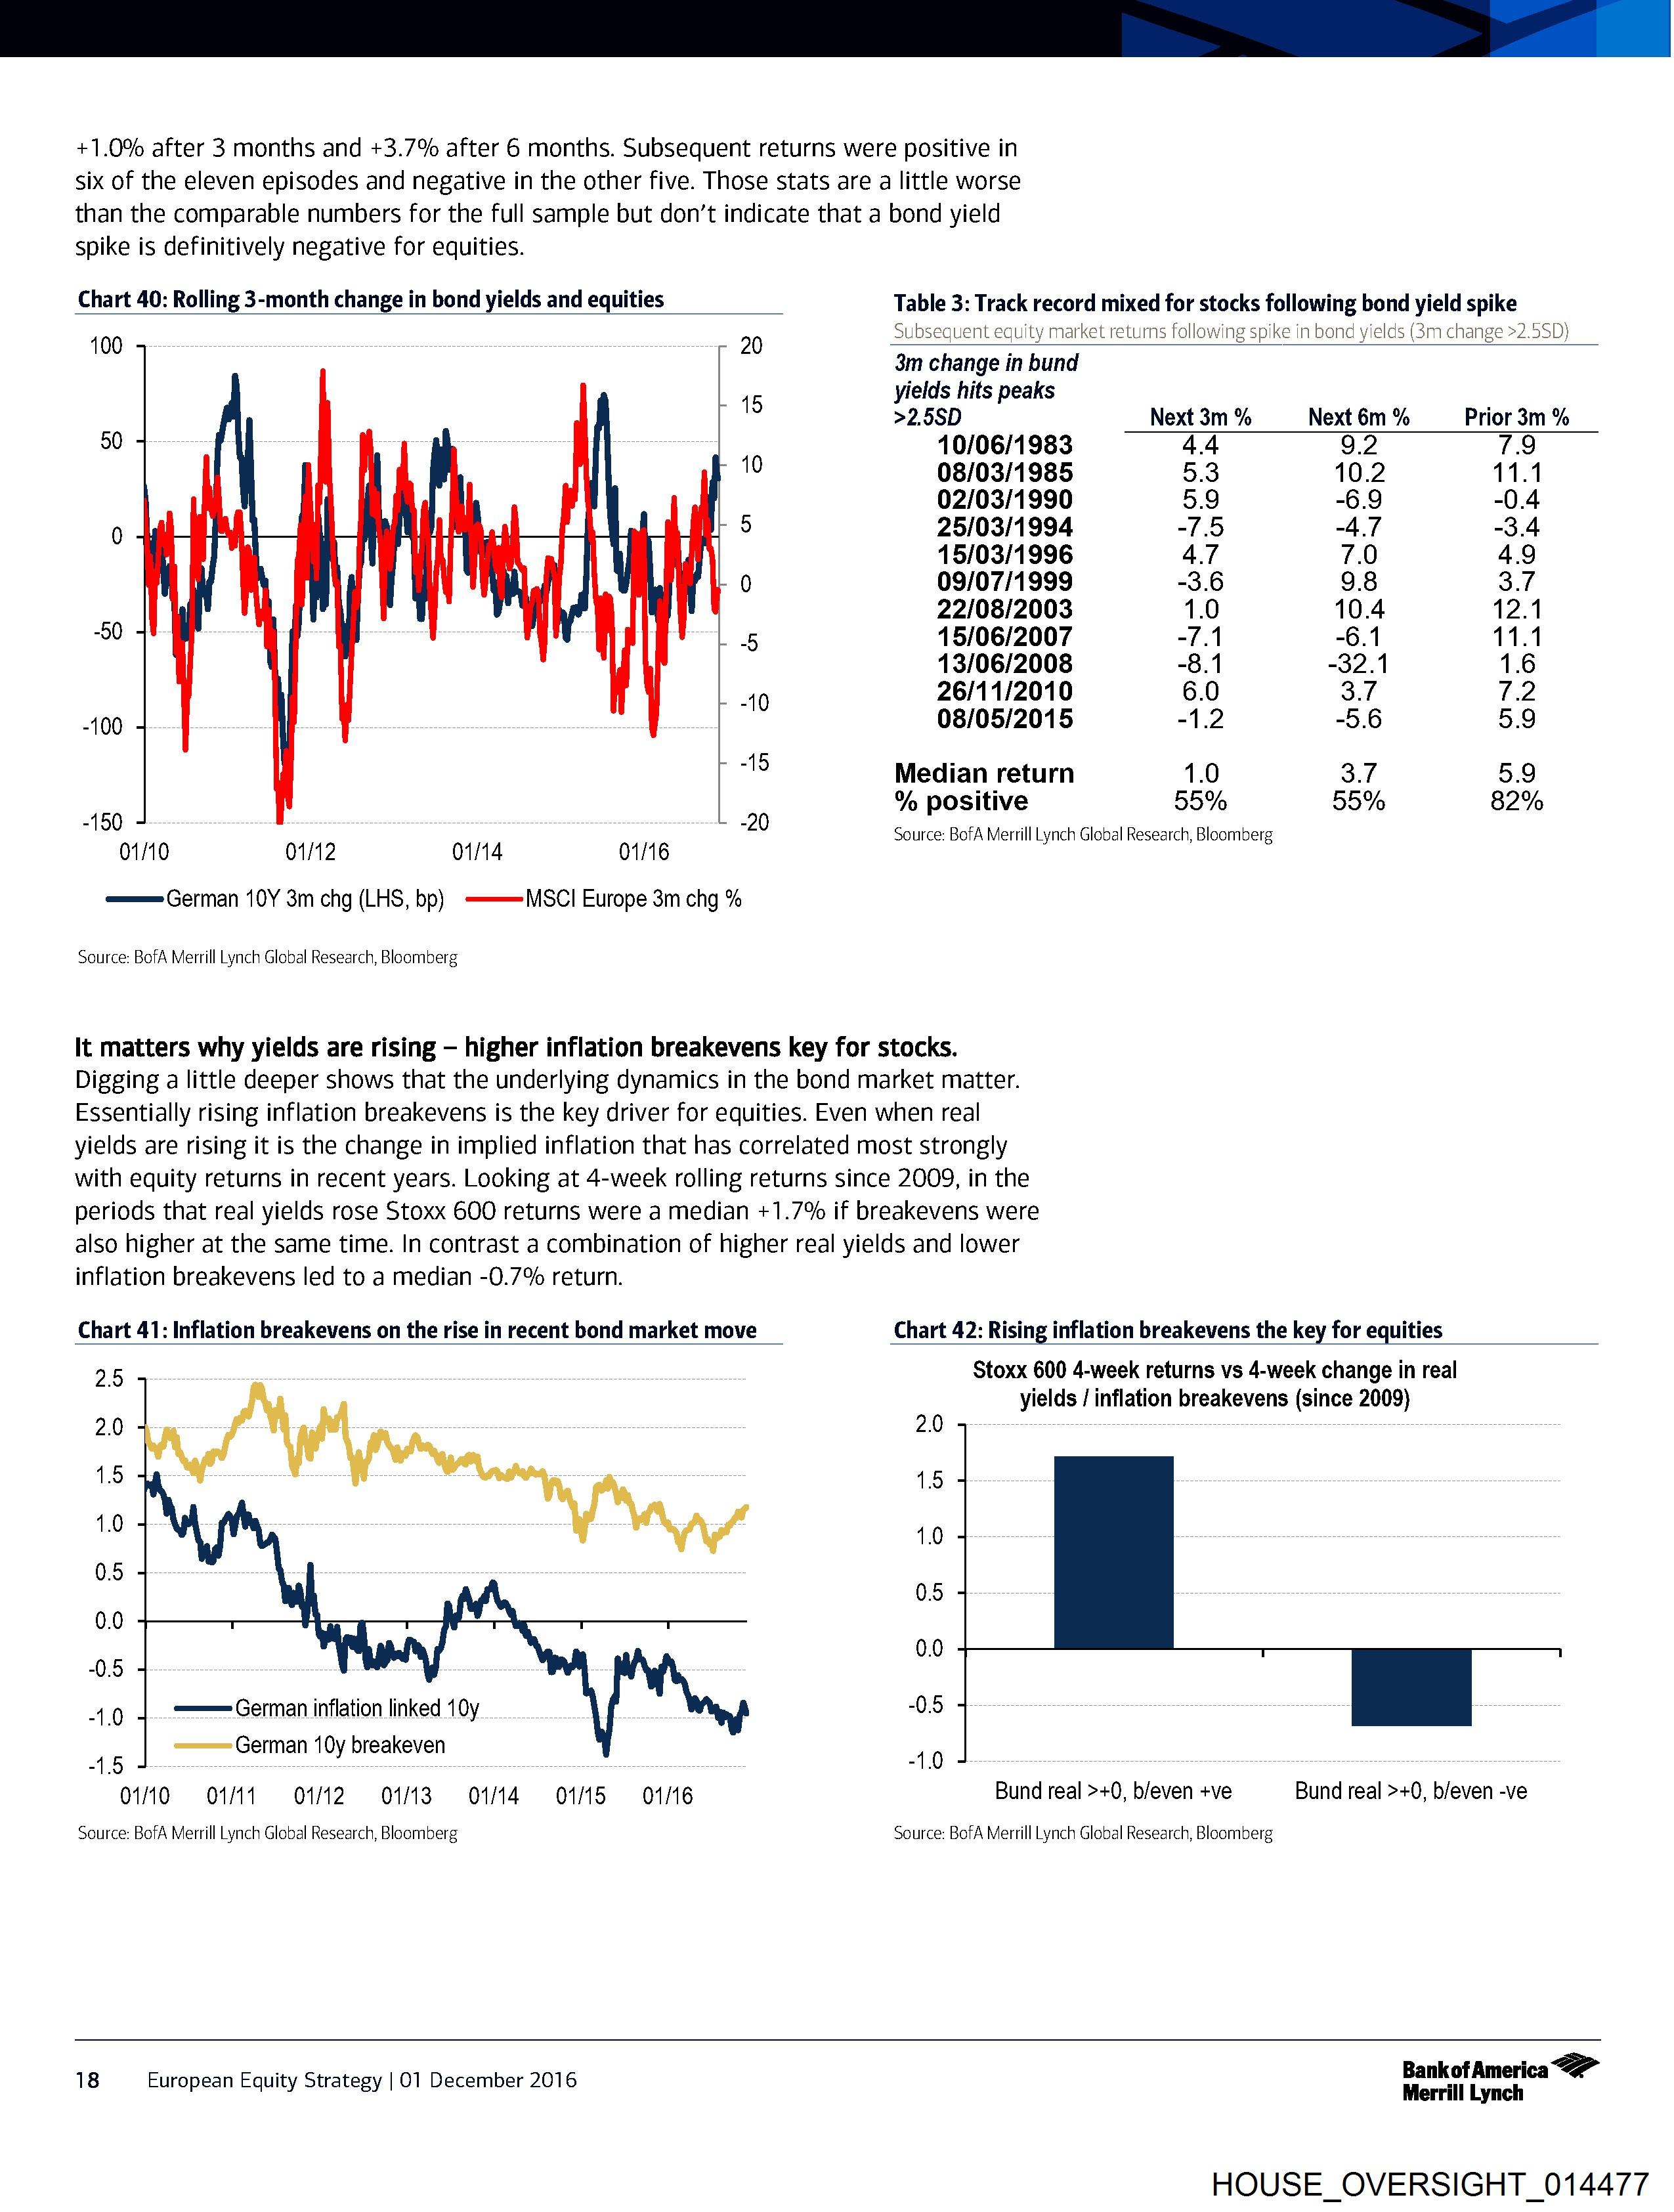
+1.0% after 3 months and +3.7% after 6 months. Subsequent returns were positive in
six of the eleven episodes and negative in the other five. Those stats are a little worse
than the comparable numbers for the full sample but don’t indicate that a bond yield
spike is definitively negative for equities.
Chart 40: Rolling 3-month change in bond yields and equities Table 3: Track record mixed for stocks following bond yield spike
Subsequent equity market returns following spike in bond yields (3m change >2.5SD}
100 20 ;
3m change in bund
15 ylelds hits peaks
>2.5SD Next 3m % Next 6m % Prior 3m %
90 10/06/1983 4.4 9.2 7.9
08/03/1985 5.3 10.2 11.1
02/03/1990 5.9 -6.9 -0.4
0 25/03/1994 -/.5 -4./ -3.4
15/03/1996 4./ 7.0 4.9
09/07/1999 -3.6 9.8 J.f
22/08/2003 1.0 10.4 12.1
“00 15/06/2007 -/.1 -6.1 11.1
13/06/2008 -8.1 -32.1 1.6
26/11/2010 6.0 Sef 7.2
-100 08/05/2015 -1.2 -5.6 3.9
Median return 1.0 Bf 9.9
% positive 95% 95% 82%
“190 20 Source: BofA Merrill Lynch Global Research, Bloomberg
01/10 01/12 01/14 01/16
ee (German 10Y 3m chg (LHS, bp) -———=MSCI Europe 3m chg %
Source: BofA Merrill Lynch Global Research, Bloomberg
It matters why yields are rising — higher inflation breakevens key for stocks.
Digging a little deeper shows that the underlying dynamics in the bond market matter.
Essentially rising inflation breakevens is the key driver for equities. Even when real
yields are rising it is the change in implied inflation that has correlated most strongly
with equity returns in rece
HOUSE_OVERSIGHT_012487.jpg
ID: 9441
Description:
Pages: 1
OCR done: 1
Downloaded: 1
OCR updated: 2026-04-09 10:24:33
Source status: needs_review
Local path: /HOUSE_OVERSIGHT_FILES/HOUSE_OVERSIGHT_012487.jpg

70
11
12
13
14
15
16
17
18
19
20
21
22
23
24
ownk
oOo OO DOD VY OD oO BP W DPD
~0929104.1XT
It was just like we put up a camera somewhere and
put a timer on it. We didn't have anybody take
It.
BY MR. TEIN:
y=)
Oo fF Do FP BP F DB FP BP PP DD PY
OD FPF Oo FY
BY MR. TEIN:
Q.
correct?
A.
Q.
You posted that on your MySpace page?
Yeah.
Go to 25-013. Is that a photo of you?
Yep.
Who's in the photo with you?
steven.
steven ae:
Yep.
Is this you coming out of the shower?
Yes.
Are you clothed in this picture?
Yeah. 1! have a halter dress on.
Where is that picture taken?
108
In Steven's house.
Did you post that on the Internet?
Yes.
All right.
MR. TEIN: You can take that down.
Now your boy friend is Brett
Yeah.
You [ie about your age in order to conceal!
something about your relationship with Brett a.
isn't that correct?
A.
No.
Page 92
HOUSE_OVERSIGHT_012487
HOUSE_OVERSIGHT_012486.jpg
ID: 9440
Description:
Pages: 1
OCR done: 1
Downloaded: 1
OCR updated: 2026-04-09 10:24:32
Source status: needs_review
Local path: /HOUSE_OVERSIGHT_FILES/HOUSE_OVERSIGHT_012486.jpg
oOo ws OD oO FPF W WD
~0929104.1TXT
currently and that was before she worked there, and we
just thought it would be funny.
MR. TEIN: 19-007. Can you enlarge that?
BY MR. TEIN:
Q. Who took this photo of you simulating you
having sex with a man?
A. We're not simulating having sex, and
[t's -- oh, and the person who took it was, I'm pretty
sure, Chris, but | know him as | don't know his
last name.
Q. Go to 19-006, please.
Who took this photo of you simulating sex
with a man?
A. The same person. And we're not simulating
having sex, Mr. --
Q. Tein.
Did you post that on the Internet?
A. Actually, this is an old MySpace ! never
Finished and | never like did anything. 1 just kind of
made it and left it.
Q. So the answer is yes, you posted this on
107
MySpace?
A. Yup.
Q. Go to 25-016. Who took this photo of you
simulating sex with a woman?
MR. LEOPOLD: Object to the form of the
question. Argumentative.
THE WITNESS: First off, she's piercing my
belly button or repiercing it, and |'m pretty sure
Page 91
HOUSE_OVERSIGHT_012486
HOUSE_OVERSIGHT_012485.jpg
ID: 9439
Description:
Pages: 1
OCR done: 1
Downloaded: 1
OCR updated: 2026-04-09 10:24:30
Source status: needs_review
Local path: /HOUSE_OVERSIGHT_FILES/HOUSE_OVERSIGHT_012485.jpg

—h
Co OO 8 “4 ODO Oo FF WwW PD
—_
m& W WN
~0929104. IXT
105
A. Uh-huh. t'm guessing.
Q. Do you know her phone number?
A. No, | do not.
Q. Let's look at 25-010.
A, see, I'm drinking --
Q. ['m not asking you about what you're
drinking.
Who are the men in this photo who are
pretending to gang up on you and stab you with knives?
Who are they?
A. Nick QM and Brandon BE (phonetic).
Q. Are they firemen?
A. Are those? Steven P| -- he said the
two stabbing with knives. That's why | said that. |
don't know. That's Steven P| and John a.
Q. Are these firemen?
A. No. They're all on -- except Steven,
they're all on full rights for football.
Q. Go to 025-015?
MR. LEOPOLD: 025- dash?
MR. TEIN: O15.
THE WITNESS: Gosh, that's so long ago.
BY MR. TEIN:
Q. Who took the photo have you ticking the
penis?
106
A. My stepmother.
Whose idea -- that was your stepmother's
idea?
A. lt was in Buca di Beppo, where she works
Page 90
HOUSE_OVERSIGHT_012485
HOUSE_OVERSIGHT_012484.jpg
ID: 9438
Description:
Pages: 1
OCR done: 1
Downloaded: 1
OCR updated: 2026-04-09 10:24:28
Source status: needs_review
Local path: /HOUSE_OVERSIGHT_FILES/HOUSE_OVERSIGHT_012484.jpg

~0929104. TXT
23 A. No.
24 What's her last name?
25 A. ae. | don't Know how to spel! it?
5)
104
1 Q. ls she the person whose house you went to
2 on New Year's this year?
3 A. No. | wasn't at her house on New Year's.
4 Q. Where were you when you took the picture of
9 Can you say blazed? That on your website?
6 A. | wouldn't Know or -- wait. We were at a
7 birthday party for some girl's 16th birthday.
8 Q. Were you drinking at that party?
9 No. There was no alcohol or anything
10 there.
11 Q. What does “blaze” mean to you?
12 A. It's Like -- it just means like messed up.
13 But we weren't, if you look at the picture.
14 Q. Messed up like drunk, right?
15 A. Sure.
16 q. who's iP
17 A. A girl | know like from like two years ago.
18 Q She's the one you were supposed to be
19 staying with when you went drinking with lick i
20 A. No.
21 Q. what's i s last name?
22 a
20 Q. Where does she live?
24 A. | don't know. In Royal Palm.
Page 89
HOUSE_OVERSIGHT_012484
HOUSE_OVERSIGHT_012483.jpg
ID: 9437
Description:
Pages: 1
OCR done: 1
Downloaded: 1
OCR updated: 2026-04-09 10:24:26
Source status: needs_review
Local path: /HOUSE_OVERSIGHT_FILES/HOUSE_OVERSIGHT_012483.jpg

er
f By
18
19
20
21
22
23
24
25
— |
Oo OO OBO 4 Oo oO BSB WwW PD
> Oo > Oo >
~0929104. TXT
| don't know how to --
Have you spoken to her about this case?
No.
Who's Vince?
My sister's friend. | don't really speak
to him at all.
case?
What's his last name?
103
And have you spoken to Vince about this
No, sir.
Have you spoken to po about this case?
Not in detail, but yes.
MS. BELOHLAVEK: Are we referring to
BY MR. TEIN:
>
Pres ee ee
THE WITNESS: Yes.
MR. TEIN: Yes,
MS. BELOHLAVEK: Okay.
Have you spoken to Justin about this case?
Justin?
Do you have a friend named Justin?
[| do not have a friend named Justin.
From freshman year’?
No.
How about Sg
No.
Have you spoken to = about this case?
Page 88
HOUSE_OVERSIGHT_012483